
2023-127 The California Public Utilities Commission
Without Improving Its Oversight, the Benefits of Energy Efficiency Programs May Not Be Worth Their Cost to Ratepayers
Published: March 18, 2025Report Number: 2023-127
March 18, 2025
2023‑127
The Governor of California
President pro Tempore of the Senate
Speaker of the Assembly
State Capitol
Sacramento, California 95814
Dear Governor and Legislative Leaders:
The Joint Legislative Audit Committee directed my office to conduct an audit of the California Public Utilities Commission (CPUC) and its role in overseeing energy efficiency programs (efficiency programs), which aim to reduce energy usage in California. For the period 2012 through 2022, we reviewed portfolios of efficiency programs (program portfolios) that four large utilities—Pacific Gas & Electric, San Diego Gas & Electric, Southern California Edison, and Southern California Gas Company—maintain, and we selected a total of 20 efficiency programs to examine in greater detail. We identified several concerns about the effectiveness of the utilities’ program portfolios and efficiency programs, and with the effectiveness of the CPUC’s oversight of these program portfolios and efficiency programs.
The CPUC expects utilities to develop cost-effective program portfolios and to meet or exceed the CPUC’s annual goals for electricity and natural gas savings. The utilities report to the CPUC efficiency program costs and energy savings information, which allows the CPUC to measure energy savings relative to its established goals and cost-effectiveness. We compared utilities’ reported savings and found that utilities’ program portfolios generally fell short of achieving goals. We found that the four utilities’ program portfolios were rarely cost-effective and that 20 efficiency programs we reviewed did not achieve expected energy savings and were also generally not cost-effective.
The CPUC’s limited oversight of utilities’ efficiency programs creates a risk that may result in the State missing opportunities to achieve meaningful energy savings. To address these shortcomings, we recommend that the CPUC could better protect ratepayers by increasing its monitoring of utilities’ efficiency programs, proactively identifying underperforming efficiency programs, and eliminating those that do not save sufficient energy or do not prove to be cost‑effective. We also recommend that the Legislature consider amending state law to require the CPUC to eliminate funding for chronically underperforming programs.
Respectfully submitted,
GRANT PARKS
California State Auditor
Selected Abbreviations Used in This Report
| CalSHAPE | School Energy Efficiency Stimulus Program |
| CPUC | California Public Utilities Commission |
| EM&V | Evaluation, Measurement, and Verification |
| ETP | emerging technologies program |
| HVAC | heating, ventilation, and air-conditioning |
| PG&E | Pacific Gas & Electric |
| SCE | Southern California Edison Company |
| SDG&E | San Diego Gas & Electric |
| SoCalGas | Southern California Gas Company |
| TRC | Total Resource Cost |
Summary
Results in Brief
The California Public Utilities Commission (CPUC) is responsible for regulating public utilities, including the Pacific Gas & Electric (PG&E), Southern California Edison (SCE), San Diego Gas & Electric (SDG&E) and Southern California Gas Company (SoCalGas). To assist the State in saving energy and developing new energy saving technologies, the State established energy efficiency programs (efficiency programs) that ratepayers fund through a surcharge on their bills. Our audit period was from 2012 through 2022, and our review focused on efficiency programs that PG&E, SCE, SDG&E, and SoCalGas funded that aimed to reduce energy use. Utilities use many different types of efficiency programs, such as those that replace inefficient appliances or that identify new technologies that can reduce energy use to achieve energy-savings goals that the CPUC establishes each year. These energy savings contribute to California meeting its greenhouse gas reduction goals because when those in the State use less energy, energy suppliers produce fewer emissions. The utilities administer portfolios of efficiency programs (program portfolios), which the CPUC approves as part of its regulatory oversight. In our review, we identified several concerns with the effectiveness of utilities’ efficiency programs and the CPUC’s oversight of these programs.
Decreased Spending on and Effectiveness of Efficiency Programs
Utilities’ spending on efficiency programs has significantly decreased during the last 10 years. When we reviewed the amount of ratepayer funds that utilities spent from 2012 through 2022, we found that utilities’ total spending on efficiency programs declined by nearly half, decreasing from its peak of more than $900 million in 2015 to just over $480 million in 2022.1 The CPUC has performed little oversight in this area, but it asserted that identifying alternative approaches to generate energy savings has become a challenge for utilities. It appears that utilities have begun to exhaust more straightforward energy-savings approaches—such as the installation of LED lighting—because an increasing number of ratepayers have already adopted these technologies, and therefore demand for these types of efficiency programs, and the resulting spending, are decreasing. Further, as the State has increased the rigor of energy efficiency standards for buildings and appliances, opportunities to save energy have lessened because utilities no longer receive credit for certain reductions in energy usage.
The CPUC establishes goals for the amount of electricity and natural gas savings utilities’ program portfolios should achieve each year, and it requires utilities to report on their progress in achieving these goals. However, we found that utilities’ program portfolios typically do not achieve energy-savings goals. When we compared the reported actual energy savings to the goals, we found that utilities generally fell short, particularly for electricity savings goals. For example, SCE’s program portfolio achieved less than half of its expected electricity savings in 2021 and 2022. When we reviewed the performance of a selection of 20 specific efficiency programs, we found that they also did not generally achieve the expected amount of energy savings. For example, a SDG&E efficiency program that offers no-cost or discounted energy efficiency improvements to small commercial customers never achieved its annual projected energy savings from 2018 through 2022.
We also found that the costs to operate efficiency programs frequently outweighed the resulting benefits, which results in utilities’ using ratepayer dollars for efficiency programs that do not perform well. State law requires the CPUC to identify all potentially achievable cost-effective electricity and natural gas efficiency savings for electrical and gas corporations as part of its supervision of utilities’ efficiency programs. To measure cost-effectiveness, the CPUC has established a measure called the Total Resource Cost (TRC), which divides efficiency program benefits that a program provides by the costs of the program. The result of this calculation is a number, and a value of 1 or greater means that an efficiency program is cost-effective. The text box shows the calculation of the TRC for one of SoCalGas’s efficiency programs. When we reviewed the TRC of utilities’ program portfolios from 2012 through 2022, we found that they were rarely cost‑effective.
The TRC Calculation for One SoCalGas Residential Efficiency Program:
Benefits: $29.8 million
- This value reflects the benefit to the utility of reduced costs to supply energy, such as purchasing fuel to generate electricity, but excludes benefits to participants.
Costs: $42.6 million
- Includes costs to the utility, such as $1.6 million for administration, and net costs to participants, totaling $15.6 million.
TRC (Benefits Divided by Costs): 0.7
Source: CPUC data.
Weaknesses in the CPUC’s Oversight
The CPUC could better protect ratepayers by implementing certain improvements to its oversight of utilities’ efficiency programs. Currently, the CPUC neither monitors whether utilities’ program portfolios achieved the energy-savings goals that it sets, nor whether efficiency programs are cost-effective, despite having this information readily available. Given its broad authority and oversight role, we expected the CPUC to review the performance of utilities’ efficiency programs, direct utilities to identify and take corrective action when they fall short of expected savings and cost-effectiveness measures, and not allow utilities to continue operating underperforming efficiency programs year after year. Instead, the CPUC indicated that it asks utilities to use actual energy savings achieved to inform their planning of future program portfolios rather than direct the utilities to change efficiency programs. The CPUC’s lack of oversight in this area creates a risk that the State will miss opportunities to achieve meaningful energy savings and greenhouse gas reductions and potentially undermine its progress toward these goals.
The CPUC uses ratepayer dollars to fund independent studies of the effectiveness of efficiency programs but does not ensure that utilities use the results of the studies to improve their program portfolios. In 2022 the utilities collected about $29 million to pay for the CPUC’s studies. Such studies result in recommendations that could help utilities save energy. Nevertheless, the CPUC neither ensures that utilities respond to the recommendations, nor tracks when utilities implement them, all of which limits the potential value these studies could provide in improving efficiency programs.
Finally, the approach the CPUC takes to measure cost-effectiveness with its calculation of the TRC may discourage utilities from implementing certain efficiency programs, and the approach may contribute to utilities regularly not having cost‑effective program portfolios. We found that the TRC calculation does not include certain non-energy-related benefits realized by the participants of efficiency programs. For example, when an efficiency program provides rebates to a business for replacement of its heating, ventilation, and air-conditioning system with a more energy efficient system, the TRC includes the costs to that business for installing the system but does not include the benefits to that business, such as clearer air and a healthier workforce. When we reviewed the practices of other states, we found that Vermont increases benefits by 15 percent to estimate non-energy benefits. Even though the actual non-energy benefits participants receive could be different than 15 percent, Vermont’s estimate at least attempts to account for these benefits.
The absence of participant benefits in the CPUC’s TRC calculation also produces lower TRC values for certain programs that provide efficiency benefits directly to program participants, such as programs that install equipment in ratepayer homes. Although the CPUC noted that such benefits are difficult to estimate, we found that other states, such as Massachusetts, use various estimation methods to account for these non-energy benefits, which ultimately increase the values in their cost-effectiveness calculations. The lack of non-energy participant benefits in the CPUC’s TRC calculation contributes to the challenges utilities have experienced in achieving cost-effective program portfolios. Because the CPUC requires utilities to operate program portfolios that have a TRC of 1 or higher, meaning the benefits outweigh the costs, the utilities have little incentive to expand the use of programs that benefit participants if those benefits are not included in the TRC calculation. Without the CPUC exercising greater oversight to improve the performance of efficiency programs, including requiring utilities to take corrective action to address underperforming programs and following up on recommendations for program improvement, it is unclear whether the required funding ratepayers provide to pay for these programs continues to be justified.
To address these findings, and to protect ratepayers from utilities using funds on ineffective or underperforming efficiency programs, our overall recommendations are that the CPUC do the following:
- Monitor the energy-savings performance of utility program portfolios, proactively identify efficiency programs that are underperforming, and eliminate them.
- Track and ensure that utilities implement recommendations to improve efficiency programs and adjust its TRC calculation to account for participant non‑energy benefits.
We also recommend that the Legislature consider amending state law to require the CPUC to eliminate funding for chronically underperforming programs.
Agency Comments
The CPUC generally agreed to implement our recommendations. The California Energy Commission (Energy Commission) disagreed with the one recommendation we made to it and some of our conclusions.
Introduction
Background
The California Constitution established the California Public Utilities Commission (CPUC) as the entity responsible for regulating public utilities, including investor‑owned utilities (utilities). Three utilities—PG&E, SCE, and SDG&E—provide a majority of electricity to ratepayers in California. PG&E and SDG&E also provide natural gas service to their ratepayers; SoCalGas—which is affiliated with SDG&E (both are subsidiaries of Sempra Energy)—provides natural gas service primarily in SCE’s service area. Our audit period was from 2012 through 2022, and our review focused on energy efficiency programs (efficiency programs) that PG&E, SCE, SDG&E, and SoCalGas funded which aim to reduce energy use.
CPUC and Efficiency Programs
State law requires the CPUC to supervise the administration of efficiency programs. The legislative intent of CPUC’s supervision of such programs is to produce cost‑effective energy savings, reduce ratepayer demand, and contribute to the safe and reliable operation of the distribution grid. The law also requires the CPUC to identify all potentially achievable cost-effective electricity and natural gas efficiency savings and to establish efficiency targets for electricity and natural gas corporations, including the utilities we examined. As further evidence of the importance of efficiency programs, in 2003 the CPUC, the Energy Commission, and the California Consumer Power and Conservation Financing Authority adopted the Energy Action Plan, which identified reduction of energy use as one of six actions of critical importance that require immediate action. Energy savings from efficiency programs can help the State meet its greenhouse gas reduction goals, which include reducing greenhouse gas emissions to 40 percent below 1990 levels by 2030.
To measure progress toward savings, the CPUC established numerical electricity and natural gas savings goals (energy-savings goals) for each utility’s service territory.2 The CPUC periodically sets energy-savings goals after having an independent consulting firm study achievable potential energy savings. The studies assess different technologies and strategies the utilities could use in their efficiency programs. The studies also use engineering calculations and policy analysis to determine achievable potential energy efficiency savings and assess the cost-effectiveness of those different strategies. See the specific electricity and natural gas savings for each utility from 2012 through 2022 in appendix Tables A.1 and A.2.
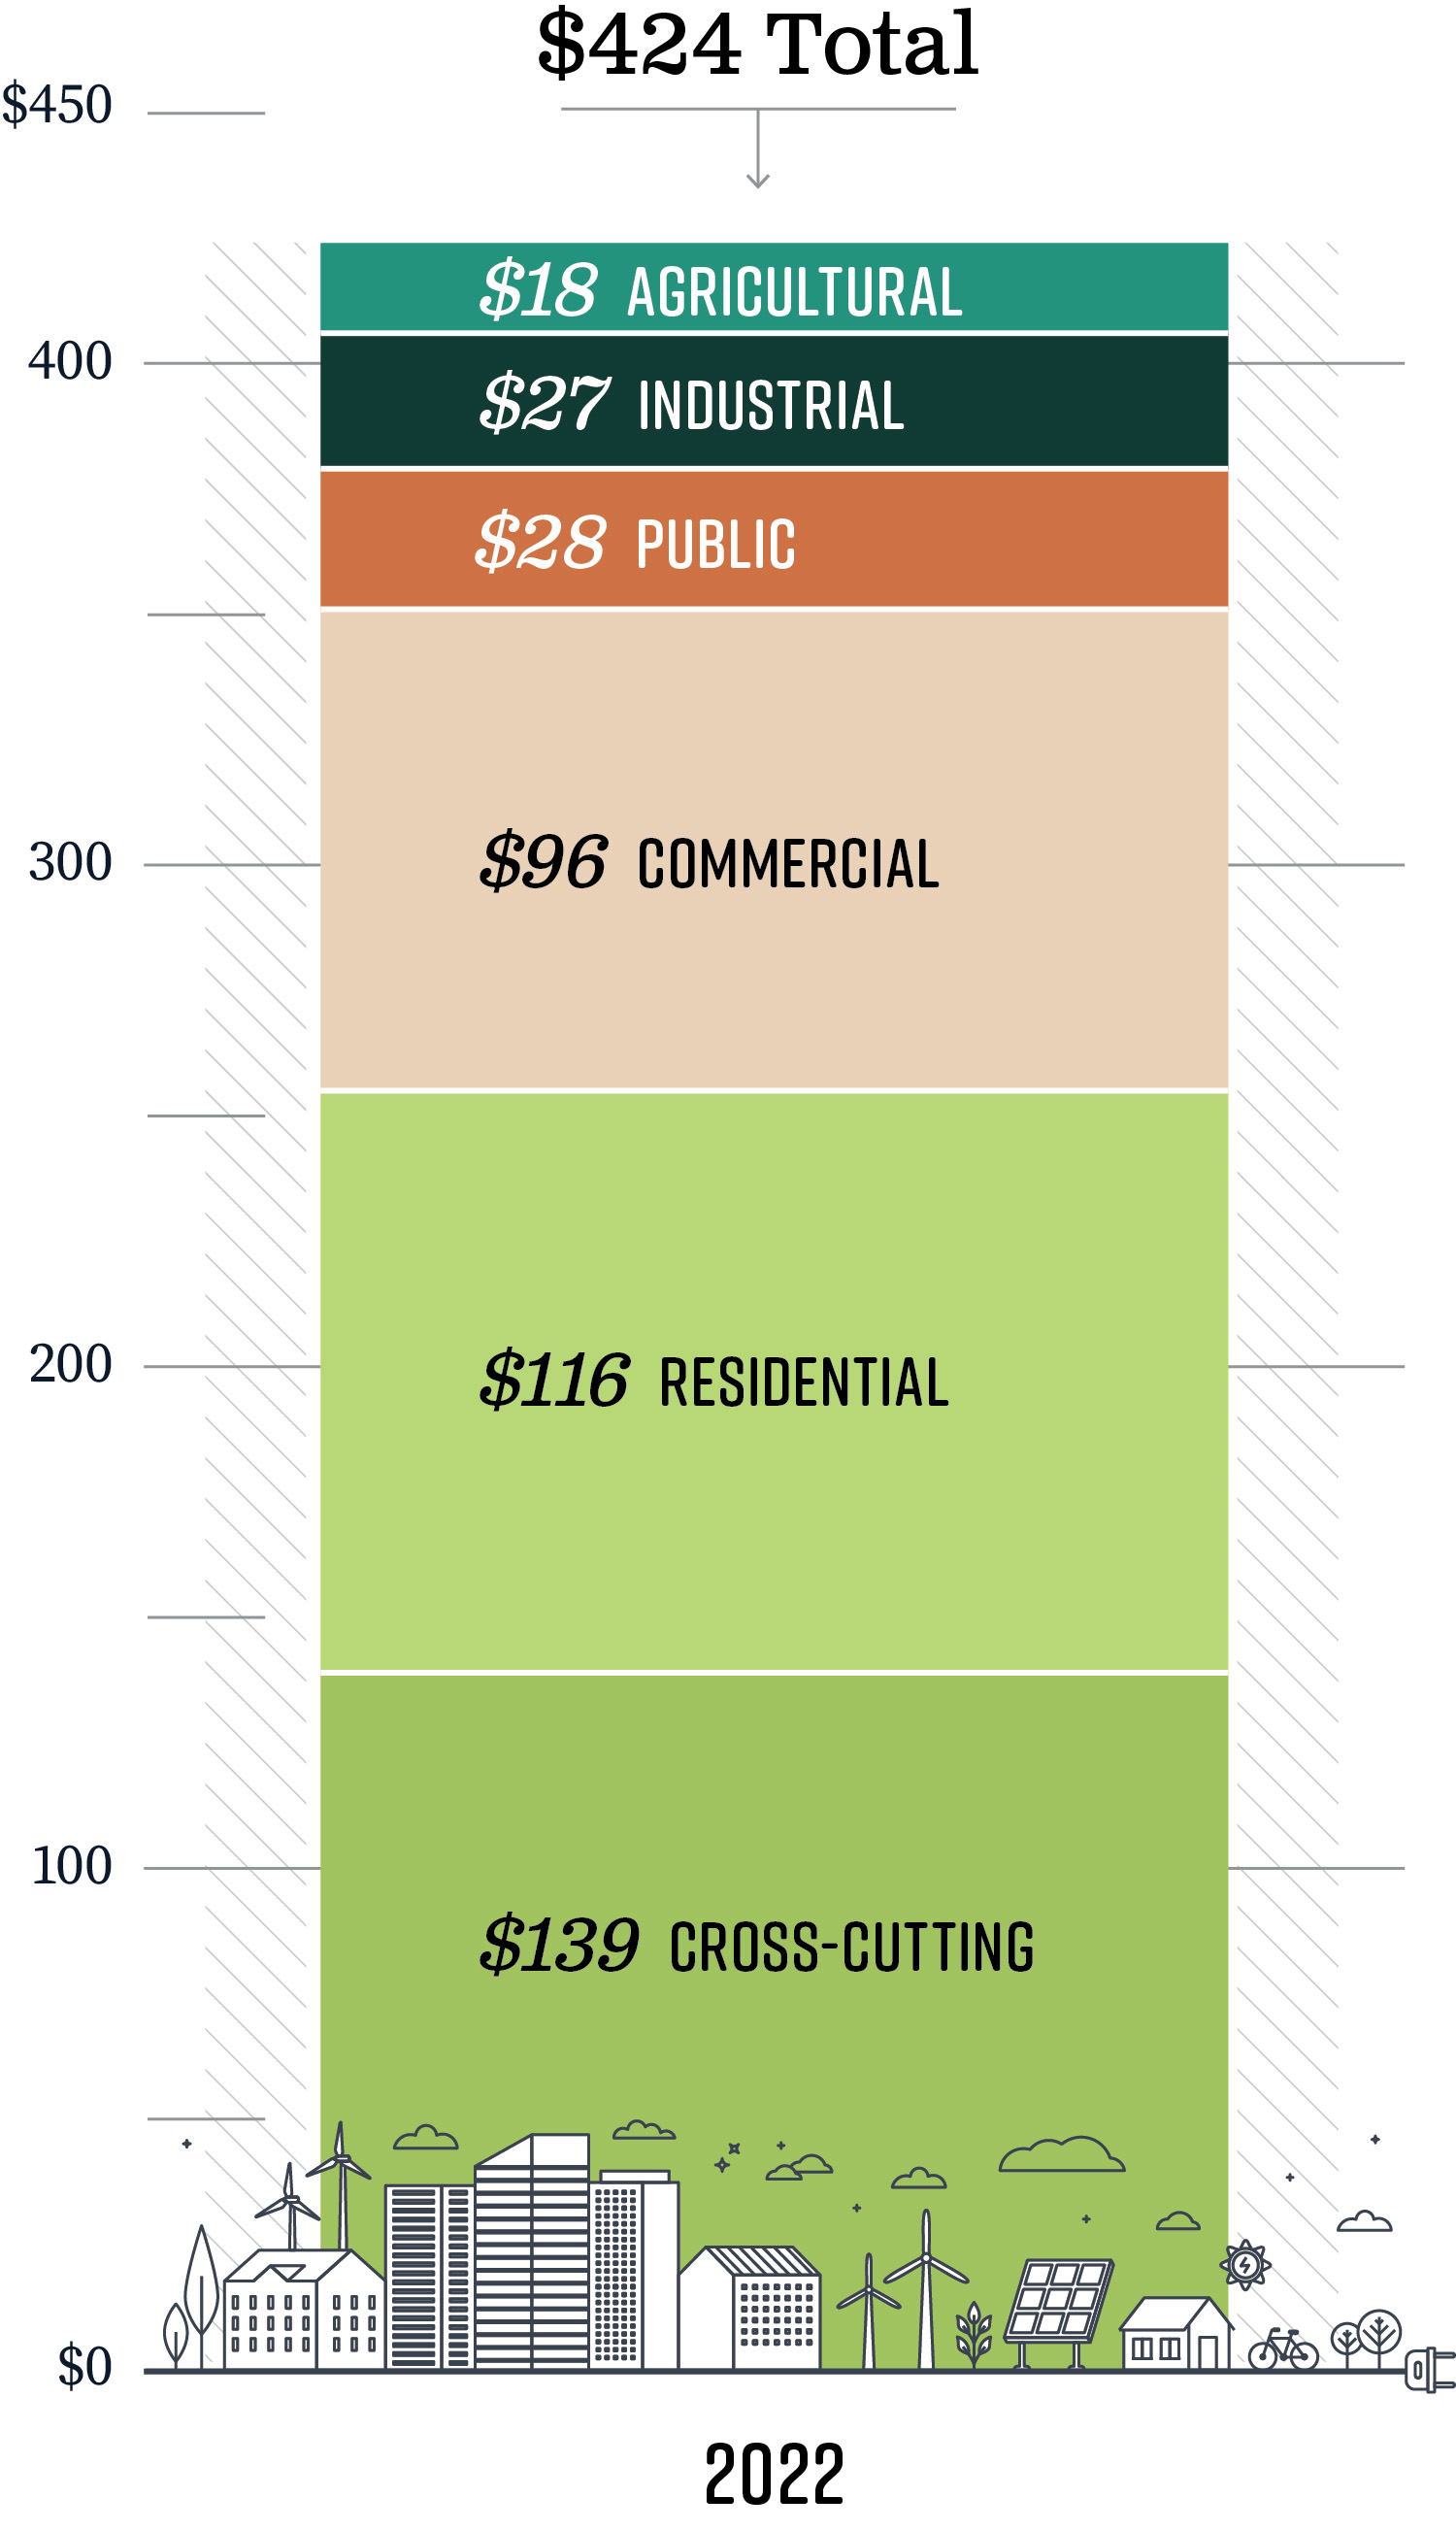
To fund their efficiency programs, state law requires utilities to add a surcharge—a separate rate component—to ratepayers’ bills and requires the CPUC to approve the amount of the surcharge. Efficiency programs represent only a small portion of the total that utilities’ collect from ratepayers to provide electricity and natural gas. Specifically, in 2022 efficiency programs accounted for $812 million, or 3 percent, of the approximately $27 billion collected by all utilities from ratepayers.3 The text box shows the amounts the four utilities collected from ratepayers for efficiency programs that year. Table 1 demonstrates how the utilities collectively spent those funds, although as we discuss in the Audit Results, there is a significant difference between the four utilities’ spending and collections in 2022. Figure 1 provides information on the economic areas, such as agricultural and commercial, in which utility efficiency programs spent ratepayer funds in 2022. Table B.1 in Appendix B provides this information for each year from 2012 through 2022.
The Four Utilities We Reviewed Collected $812 Million From Ratepayers for Efficiency Programs in 2022 (in Millions)
PG&E………………………………………………………………..$325
SCE…………………………………………………………………..$329
SoCalGas…………………………………………………………..$104
SDG&E………………………………………………………………..$54
Total…………………………………………………………………..$812
Source: CPUC data.
Figure 1
Utilities’ Efficiency Program Spending in 2022 Focused on Residential and Commercial Ratepayers (in Millions)
Source: CPUC expenditure data.
Note: Sectors are categories of industries associated with their respective economic establishments and activities. For example, expenditures categorized under the agricultural sector include an efficiency program offering rebates for agricultural irrigation pumps that help farmers’ operations. Further, expenditures in the cross-cutting sector include efficiency programs that offer services across multiple sectors, such as commercial and industrial.
Figure 1 is a bar chart showing utilities’ efficiency program spending in 2022 that was focused on residential and commercial ratepayers. The bar chart is separated into six economic sectors: agricultural, industrial, public, commercial, residential, and cross-cutting. Note: Sectors are categories of industries associated with their respective economic establishments and activities. For example, expenditures categorized under the agricultural sector include an efficiency program offering rebates for agricultural irrigation pumps that help farmers’ operations. Expenditures in the cross-cutting sector include efficiency programs that offer services across multiple sectors, such as commercial and industrial. For 2022, the agricultural sector spent $18 million, the industrial sector spent $27 million, the public sector spent $28 million, the commercial sector spent $96 million, the residential sector spent $116 million, and the cross-cutting sector spent $139 million. The total for all efficiency program spending in 2022 was $424 million. The source is CPUC expenditure data.
Utilities also collected funds from ratepayers to pay for the School Energy Efficiency Stimulus Program (CalSHAPE), in accordance with state law. The Energy Commission—an entity that is separate from the CPUC—administers CalSHAPE. The Legislature created this program, which began in 2021, to provide grants to school districts and other local educational agencies (school districts) to assess, maintain, repair, and replace their heating, ventilation, and air‑conditioning (HVAC) systems and to replace plumbing fixtures and appliances. State law directed the CPUC to require utilities with program portfolios to provide a portion of their program budgets for 2021, 2022, and 2023, and any unspent efficiency program funds from 2020 through 2022, to the Energy Commission to fund CalSHAPE. In just 2022, utilities provided nearly $320 million for the administration and funding of CalSHAPE.4 In total, the utilities have collected and delivered nearly $1 billion in ratepayer funds to the Energy Commission to fund the CalSHAPE program. We describe the administration of this program further in the Other Areas Reviewed section of this report.
Efficiency Program Administration
The CPUC does not administer or manage individual efficiency programs. Rather, the CPUC requires utilities to administer individual efficiency programs as part of a larger portfolio of such programs. The CPUC has made decisions in the past to establish its independence from directly managing utilities’ program portfolios and individual efficiency programs, instead delegating this management to the utilities. Further, it does not prescribe the technology mix, such as LED lighting or electric water heaters, that must be a part of utilities’ program portfolios. Instead, the CPUC has authorized the utilities to develop their own program portfolios, which are a collection of a utility’s efficiency programs, ranging from roughly 70 to 120 programs depending on the utility, managed together to achieve energy-savings goals. In 2022, the four utilities we reviewed had program portfolios containing a total of nearly 380 efficiency programs.
The CPUC expects the utilities to base their selection of which efficiency programs to include in their program portfolios on whether they are cost-effective and can meet or exceed the energy-savings goals it established. In two separate CPUC decisions, in 2016 and 2018, the CPUC noted that the utilities’ role should focus on the design and management of their overall program portfolios. The CPUC indicated that having utilities focus less on implementing individual efficiency programs would both encourage innovation and allow for cost savings in program delivery. The CPUC believes that competitive solicitation of efficiency programs can help utilities identify innovative approaches or technologies for meeting energy-savings goals with improved performance, which may not emerge during the program portfolio planning process. The CPUC also stated that the State’s investments in energy efficiency have enhanced private sector activity to deliver programs, drawing from the skill, experience, and creativity of the energy efficiency community, such as third-party implementers, and could lead to additional cost-effective energy savings. Additionally, the CPUC requires the utilities to allocate at least 60 percent of their budgets for efficiency programs to third-party implementers. We describe in the text box activities that third-party implementers conduct.
Third-Party Implementer Activities:
- Develop an efficiency program implementation plan.
- Design strategies or tactics to reduce barriers related to the efficiency program.
- Deliver the efficiency program in accordance with its plan to reach program participants, including hard-to-reach or disadvantaged communities.
Source: CPUC.
The CPUC requires utilities to file applications for approval of the utilities’ annual program portfolios and business plans. Each utility’s application must include the utility’s plan for how its program portfolio will meet annual energy-savings goals and cost‑effectiveness measures. Each utility’s application must also include all costs associated with the delivery of its efficiency programs. Any unspent funds from previous years, and any associated interest collected on those funds, must be included in the utility’s application and business plan as an offset to the amount of ratepayer funds it plans to collect in the following year. For instance, if a utility has $50 million in unspent funds from what it collected from ratepayers from previous years, and it then requests a budget of $300 million for the current year, the CPUC will authorize the utility to collect only $250 million from ratepayers.
The CPUC also directs studies of efficiency programs as part of its efforts to oversee and improve those programs. The CPUC contracts with third-party evaluators to complete EM&V studies. The text box describes some of the purposes of the EM&V studies. The EM&V studies provide recommendations for improvements to the design of efficiency programs and helps to ensure that the energy savings information that utilities report is accurate.
Purposes of EM&V Studies Include the Following:
- Verify energy savings for efficiency programs.
- Measure and evaluate the performance of third-party implementers and utilities.
- Improve the design and success of future efficiency programs and development of new technology.
- Generate data for savings estimates and cost‑effectiveness inputs.
Source: CPUC policy manual and commission decisions.
Cost-Effectiveness Measurement
State law requires the CPUC to identify all potentially achievable cost-effective electricity and natural gas efficiency savings for electrical and gas corporations, including the utilities we examined, and it has established a measure to determine whether the efficiency programs are, in fact, cost-effective. To ensure that utilities responsibly allocate ratepayer funds and to measure the cost‑effectiveness of utilities’ efficiency programs, the CPUC primarily uses the TRC test. As Figure 2 shows, the TRC calculation that the CPUC uses divides the benefits that an efficiency program provides by the costs of the program. The TRC allows the CPUC to understand whether a program or portfolio of programs provides more benefits than costs. A TRC value of 1 or higher indicates that a program provides more benefits than costs, and a value below 1 means that the program offers fewer benefits than its costs. Therefore, the CPUC requires utilities to submit portfolios with a TRC of 1 or higher. We describe some shortcomings we observed in the CPUC’s TRC calculation methodology in the Audit Results.
Figure 2
The TRC Calculation Determines Whether Efficiency Program Benefits Exceed Their Costs

Source: CPUC Standard Practice Manual and CPUC website.
Figure 2 is an image describing the TRC calculation the CPUC uses which divides the benefits that an efficiency program provides by the costs of the program. There are two components to benefits: benefits for utility companies and benefits for participants. A utility company’s monetary benefits of an efficiency program include, the avoided cost of supplying energy, reduced costs associated with transmitting, distributing, and generating energy, reduced capacity needed to supply energy, and other benefits. The CPUC does not include participant benefits in the TRC calculation. Similarly, there are utility company costs and participant costs in the cost section of the TRC calculation. A utility company’s cost to implement an efficiency program include administration, labor, increased energy supply, and other costs. A participant’s cost to implement an efficiency program include the purchase of energy efficiency equipment, equipment installation, and other costs. A TRC at or above 1 means that the monetary value of energy saved is equal to or greater than the cost of the program. A TRC below 1 is the cost of the program is greater than the monetary value of energy saved. The sources are the CPUC’s Standard Practice Manual and website.
The CPUC exempted certain types of programs from having to meet a TRC of 1. These are programs whose benefits the TRC does not capture but that the CPUC still considers important. Among such excluded programs are some that support long‑term energy efficiency objectives. Others that are exempt from having to meet a TRC of 1 are equity programs, which support low-income Californians by, for example, upgrading HVAC systems in areas with high outdoor pollution. Programs like these may not have significant energy savings but provide other benefits not captured by the TRC, such as allowing low-income communities to access other efficiency programs through foreign language translations, educating customers about energy efficiency techniques and knowledge for installing and maintaining energy efficiency technology. The remaining programs that must meet the TRC requirement, known as resource acquisition programs, represent the majority of efficiency programs and are primarily responsible for delivering energy savings.
Audit Results
Utilities’ Spending on Efficiency Programs Has Significantly Declined, and Programs Frequently Underperform Established Goals
Energy Efficiency Programs (efficiency programs) aim to produce cost-effective energy savings, reduce ratepayer demand for energy, and support the State’s energy policy and greenhouse gas emissions limit. As such, we reviewed the spending, energy savings, and cost-effectiveness of efficiency program portfolios (program portfolios) administered by four large utilities: Pacific Gas & Electric (PG&E), San Diego Gas & Electric (SDG&E), Southern California Edison (SCE), and Southern California Gas Company (SoCalGas). We found that utilities’ spending on efficiency programs has decreased significantly over the last several years, largely because utilities have begun to exhaust the use of straightforward energy-saving technologies—such as efficient lighting—and California’s efficiency standards have grown increasingly strict. Additionally, we reviewed whether utilities’ program portfolios achieve the energy-savings goals established by the California Public Utilities Commission (CPUC) and found that they rarely achieve energy-savings goals or cost-effectiveness. To pay for their efficiency programs, utilities collect funds from ratepayers by adding a surcharge to their energy bills. In 2022 we found that utilities significantly overcollected from ratepayers; however, we attribute a large part of this cumulative overcollection to one utility—SCE—which was not able to spend as much as projected on efficiency programs in that year. A key contributing factor to the numerous shortcomings we identified in the performance of utilities’ efficiency programs is the CPUC’s inadequate oversight of these programs, which we describe later in the report.
Utilities’ Spending on Efficiency Programs Has Decreased by Nearly Half Since 2015
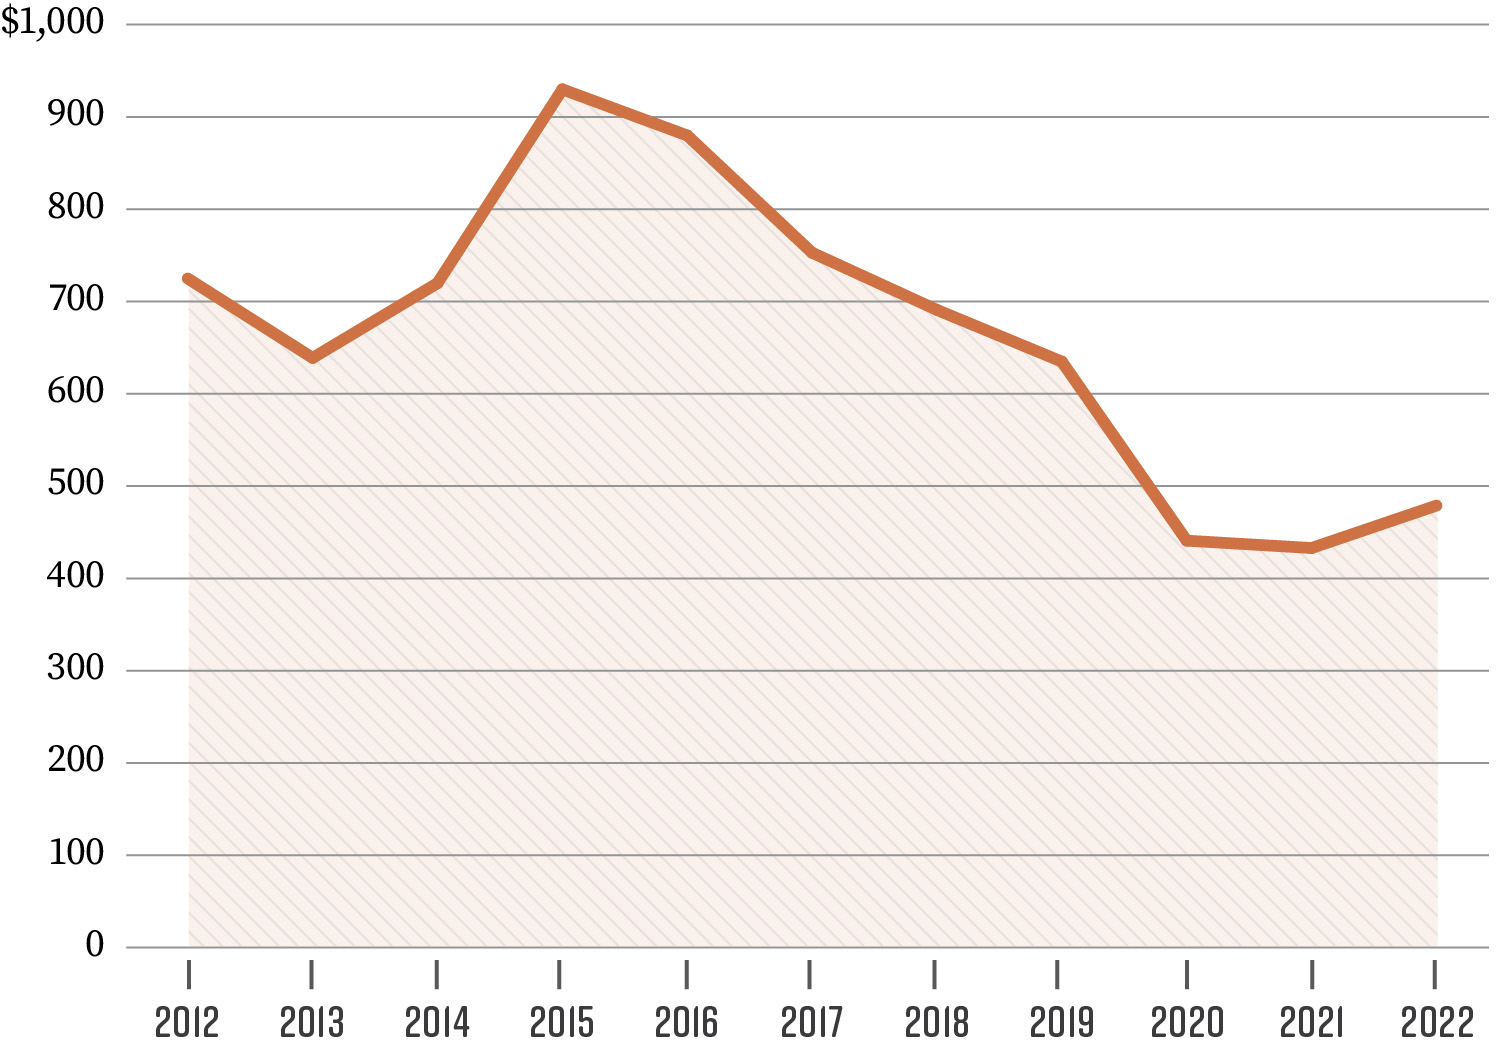
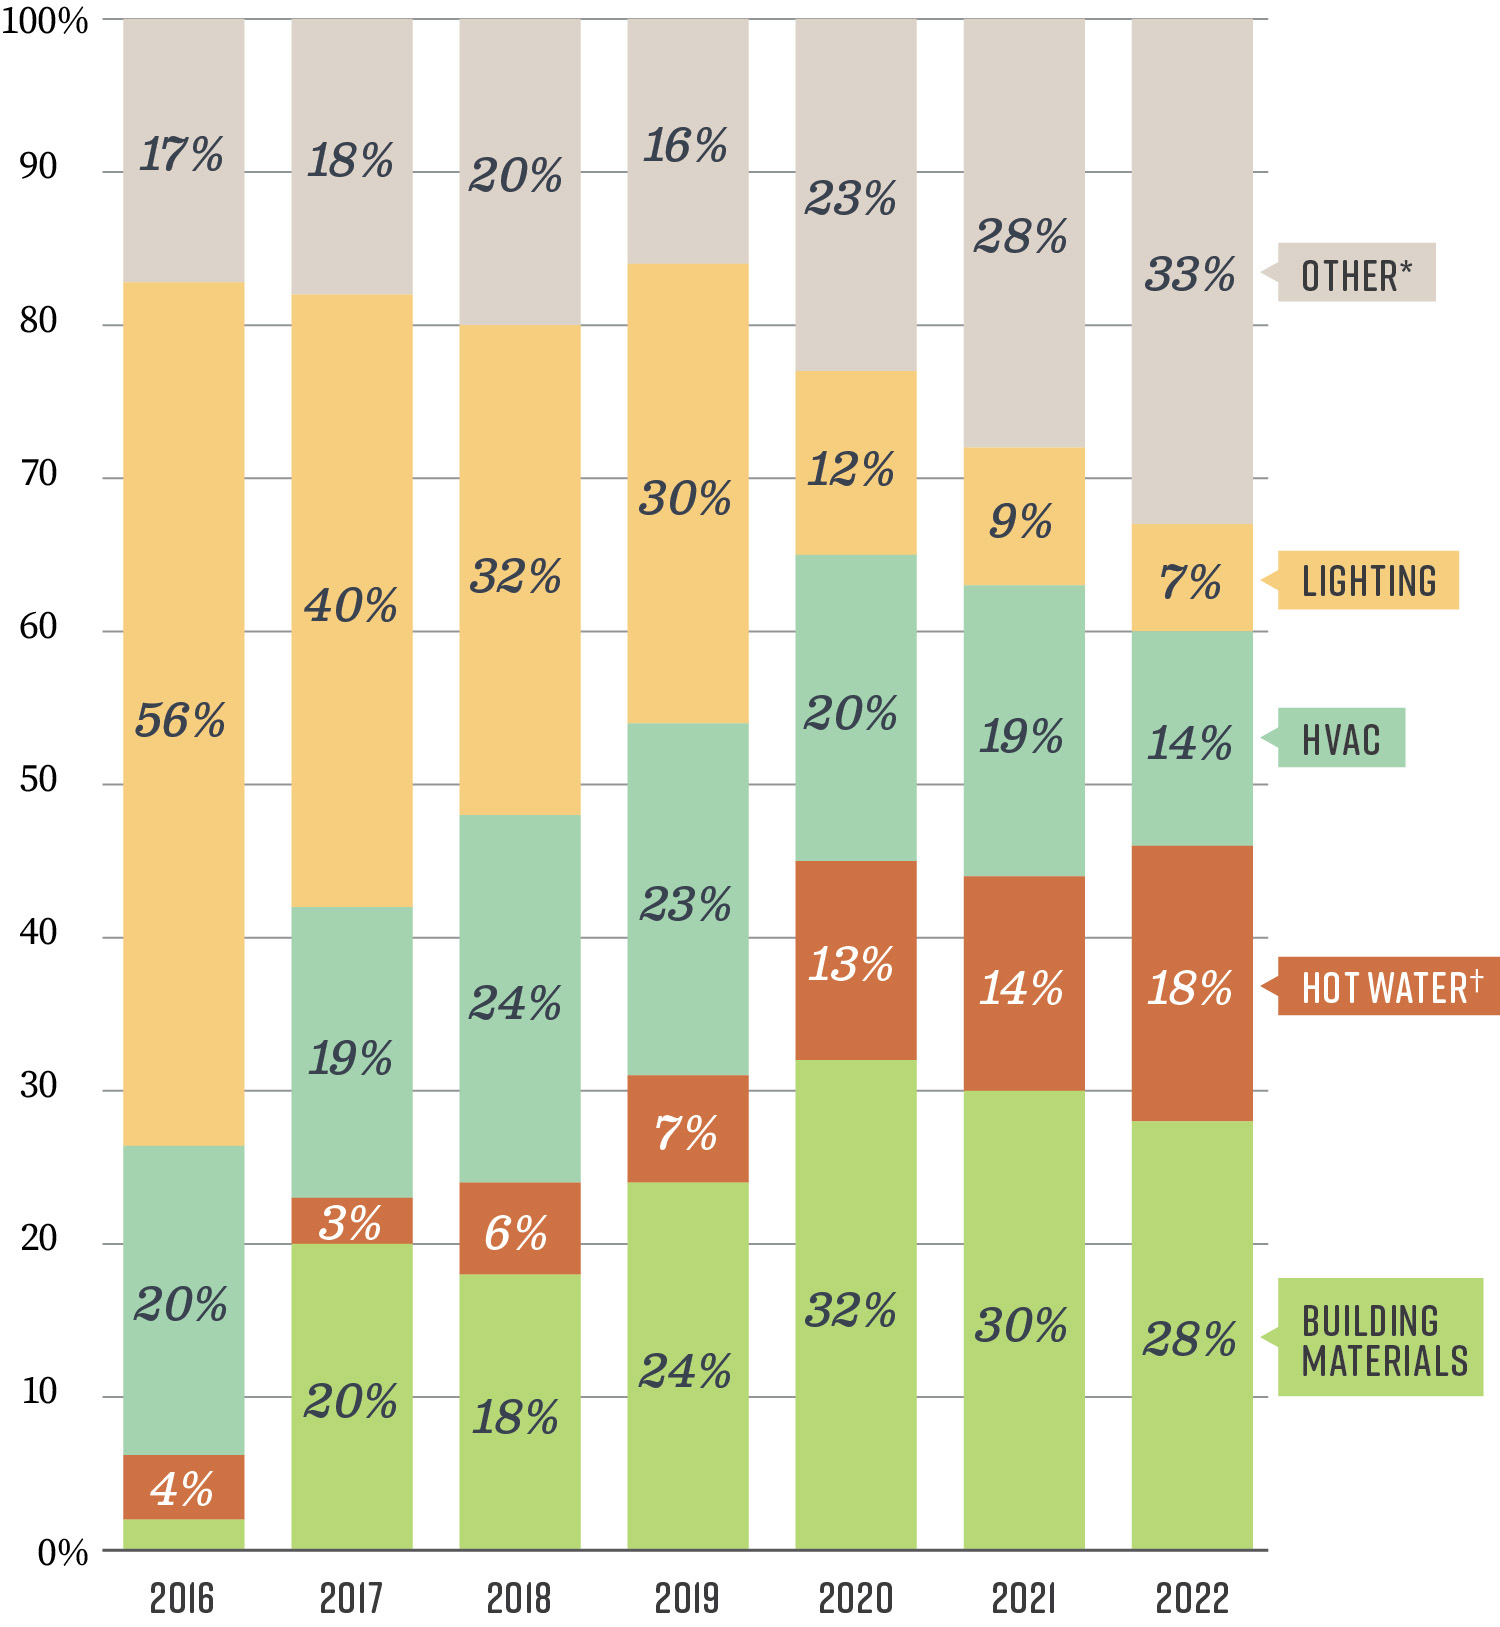
Since 2015 total spending on efficiency programs has decreased significantly, dropping from $934 million in 2015 to just $483 million in 2022, as Figure 3 shows.5 We also found that the mix of technologies aimed at increasing energy savings, such as more efficient lighting or water heaters, that utilities’ fund as part of their program portfolios has changed over time. For example, the installation of lighting technologies comprised more than half of all such installations in 2016, but as Figure 4 shows, it made up only 7 percent in 2022. We reviewed available documentation and interviewed CPUC staff to identify the reasons utilities’ spending has drastically declined from 2012 through 2022 and why the types of technologies their efficiency programs install have changed so significantly. We identified two primary factors contributing to these changing conditions: utilities have exhausted installation of straightforward energy efficiency technologies, and California’s energy efficiency standards have increased.
Figure 3
Total Spending on Efficiency Programs Has Decreased Significantly Since 2015 (in Millions)
Source: CPUC data.
Note: The Audit Committee directed the California State Auditor to identify total expenditures on efficiency programs from 2012 through 2022, which was the most recent year that complete expenditure information was available. Accordingly, we report total expenditures that include more than just the four utilities we reviewed.
Figure 3 is a line chart showing the total spending on efficiency programs has decreased significantly since 2015. In 2012, utilities spent $729 million on efficiency programs; in 2013, utilities spent $643 million on efficiency programs; in 2014, utilities spent $724 million on efficiency programs; in 2015, utilities spent $934 million on efficiency programs, which is the high point ofd this chart. In 2016, utilities spent $884 million on efficiency programs; in 2017, utilities spent $757 million on efficiency programs; in 2018, utilities spent $695 million on efficiency programs; in 2019, utilities spent $639 million on efficiency programs; in 2020, utilities spent $489 million on efficiency programs; in 2021, utilities spent $437 million on efficiency programs, which is the lowest point in the chart. In 2022, utilities spent $483 million on efficiency programs. The source is CPUC data. Note: The Audit Committee directed the California State Auditor to identify total expenditures on efficiency programs from 2012 through 2022, which was the most recent year that complete expenditure information was available. Accordingly, we report total expenditures that include more than just the four utilities we reviewed.
The CPUC has previously acknowledged that installations of straightforward technologies that produce significant energy savings will decline; as a result, efficiency programs focused on installing such technologies will eventually become obsolete. The straightforward-to-install technologies include lighting changes, such as replacing incandescent lighting with compact fluorescent lights or LEDs, which use less energy than traditional lighting and, therefore, produce significant energy savings. In a 2008 CPUC proceeding, the CPUC acknowledged that as these straightforward energy savings are achieved, the remaining options for saving energy may become more expensive. For example, home retrofits, which can involve installing wall insulation or high-efficiency furnaces, can produce significant energy savings over time, but they are complicated to implement and have high startup costs. In a 2015 CPUC proceeding, the CPUC stated that cheaper energy-savings opportunities, which it referred to as low-hanging fruit, had largely been taken, which coincides with the downward trend in utilities’ spending that we observed and present in Figure 3. Since then, the U.S. Energy Information Administration6 found that the percentage of homes across the U.S. using LED lighting increased drastically from four to nearly 50 percent from 2015 through 2020. The U.S. Energy Information Administration also found that the use of LED lighting in commercial buildings increased across the U.S. from nine percent to 44 percent from 2012 through 2018, further suggesting that opportunities to install these inexpensive technologies were decreasing.
Figure 4
Efficiency Programs That Include Installations Have Shifted Away From Lighting Technologies Since 2016
Source: CPUC data.
Note: In 2016, the utilities did not indicate the type of installation used by half of their efficiency programs because the CPUC changed data systems that year.
* The Other category includes several small categories, none of which made up more than 2.5 percent of total spending. These small categories include recreation, irrigation, and commercial refrigeration.
† The Hot Water category includes several different types of technologies or methods to save energy, including insulation for water tanks and smart thermostats on water heaters, to ensure that they only operate during hours of lower energy use.
Figure 4 is bar chart showing utilities’ efficiency programs that involve installation of energy efficiency equipment have shifted away from lighting technologies since 2016. The bar chart is separated into five installation categories: lighting, HVAC, hot water, building materials and other, which includes several small categories, none of which made up more than 2.5 percent of total spending. These small categories include recreation, irrigation, and commercial refrigeration. The hot water category includes several different types of technologies or methods to save energy, including insulation for water tanks and smart thermostats on water heaters, to ensure that they only operate during hours of lower energy use. For the other category, it steadily grows in prominence as the years advance. In 2016, spending on other efficiency programs was 17 percent; in 2017, 18 percent; in 2018, 20 percent; in 2019, 16 percent; in 2020, 23 percent; in 2021, 28 percent; and in 2022, 33 percent. For the lighting category, a stark decrease occurs over the years. In 2016, spending on lighting efficiency programs was 56 percent; in 2017, 40 percent; in 2018, 32 percent; in 2019, 30 percent; in 2020, 12 percent; in 2021, 9 percent; and in 2022, 7 percent. For the HVAC category, in 2016, spending on efficiency programs was 20 percent; in 2017, 19 percent; in 2018, 24 percent; in 2019, 23 percent; in 2020, 20 percent; in 2021, 19 percent; and in 2022, 14 percent. For the hot water category, spending increased after 2018 and again after 2020. In 2016, spending on hot water efficiency programs was 4 percent; in 2017, 3 percent; in 2018, 6 percent; in 2019, 7 percent; in 2020, 13 percent; in 2021, 14 percent; and in 2022, 18 percent. For the building materials category, in 2016, spending on efficiency programs was 2 percent; in 2017, 20 percent; in 2018, 18 percent; in 2019, 24 percent; in 2020, 32 percent; in 2021, 30 percent; and in 2022, 28 percent. The source is the CPUC data. Note: In 2016, the utilities did not indicate the type of installation used by half of their efficiency programs because the CPUC changed data systems that year.
As utilities have installed straightforward efficiency technologies, there are fewer ways for utilities to save energy in a cost-effective manner, contributing to decreased utility spending on efficiency programs. Specifically, as methods to save energy become increasingly expensive and the benefits they provide do not commensurately increase, the cost-effectiveness of efficiency programs, as measured by the Total Resource Cost (TRC), declines. As we describe in the Introduction, the CPUC requires utilities to operate program portfolios that are cumulatively cost-effective with a TRC of 1 or higher. As a result of the CPUC requirement, the utilities have no financial incentive to include in their program portfolios efficiency programs that have high costs with low benefits. The CPUC maintains this requirement because state law directs it to identify all potentially achievable cost-effective electricity and natural gas efficiency savings. Further, the CPUC’s requirement that certain efficiency programs be cost‑effective provides a key check on utilities’ selection of efficiency programs to include in their program portfolios, as utilities must select a group of efficiency programs that collectively have more benefits than costs and are therefore cost-effective as a whole.
Another contributing factor for utilities’ decreased spending on efficiency programs that the CPUC cited is the State’s increasingly strict energy efficiency standards. California regulations establish energy efficiency standards for certain buildings and appliances. For example, the 2022 California Building Standards Code limits the lighting power of internally illuminated signs, such as a business’s “open” sign, to no more than 12 watts per square foot. If a utility operates an efficiency program that replaces such signs with more efficient ones that consume only 10 watts per square foot, then the utility could only claim 2 watts per square foot in energy savings. This is even the case if the utility’s efficiency program replaced signs that previously consumed 50 watts per square foot. In other words, even though the utility may achieve a 40 watt per square foot savings, the CPUC only allows the utility to count two watts of savings towards meeting their energy‑savings goal.
The CPUC explained that as the State’s efficiency standards become more rigorous, it becomes more difficult to achieve energy savings because the utilities cannot claim savings that fall below these standards. Therefore, as energy efficiency standards increase, the total savings utilities can claim decrease and, utilities have less of an incentive to incorporate such efficiency programs into their program portfolios because it may prevent them from achieving energy-savings goals, which we describe in greater detail in the following section. Although the CPUC is not solely responsible for establishing the State’s energy efficiency standards, it does establish the method by which utilities’ must calculate the cost-effectiveness of their efficiency programs. We believe the CPUC can take action to revise its cost-effectiveness calculation to encourage utilities to increase their spending on efficiency programs.
Program Portfolios Regularly Fall Short of Achieving Energy‑Savings Goals and Cost‑Effectiveness
The majority of utilities’ program portfolios have not met energy-savings goals, are frequently not cost-effective, and individual programs have similarly fallen short of expectations. For the utilities’ program portfolios we reviewed from 2016 through 2022, we evaluated three key areas: energy savings related to electricity, energy savings related to natural gas, and their overall cost-effectiveness.7 The text box describes these three key areas. Our review found that the three utilities that provide electricity—PG&E, SCE, and SDG&E—rarely met their electric energy‑savings goals. As Table 2 shows, although all three utilities collectively met their electric energy-savings goals in 2016, none of them met their annual goals in at least five of the seven years we reviewed, and none of their program portfolios have met their electric energy‑savings goals since 2019. In fact, the utilities’ program portfolios in 2022 achieved from just 45 percent to 60 percent of the electric energy savings envisioned in the goals.
Key Areas We Reviewed:
Electric Energy‑Savings Goals
The CPUC sets electric energy‑savings goals and they are expressed in terms of saving gigawatt hours (GWh) of electricity. One GWh of electricity is equal to the average annual electricity consumption of 162 households.
Natural Gas Energy‑Savings Goals
The CPUC sets natural gas energy‑savings goals and they are expressed in terms of saving million-therms (MMTherms) of natural gas. One MMTherms of natural gas is equal to the average annual natural gas consumption of over 2,700 households.
Cost-Effectiveness
The CPUC divides the benefits that an efficiency program provides by its costs to produce a TRC value. This allows the CPUC to understand whether a program or portfolio of programs provides more benefits than costs. A TRC value of 1 or higher indicates that a program provides more benefits than costs. A value below 1 means the program offers fewer benefits than its cost.
Source: CPUC documentation.
Cumulatively, the amount of missed electric savings can be significant. For example, in 2022 the CPUC set the energy-savings goal at 425 GWh for SCE’s program portfolio. However, SCE’s portfolio only saved 192 GWh, or 45 percent, of its electric energy‑savings goal for that year. From 2016 through 2022, we found that the three electric utilities’ program portfolios collectively fell short of their electric energy-savings goals by 19 percent, or by more than 1,400 GWh, which is equivalent to the annual electricity use of nearly 230,000 households.
Similarly, as Table 3 shows, the program portfolios for two of the three utilities that provide natural gas—SDG&E and SoCalGas—did not meet their natural gas energy‑savings goals in more than half of the years that we reviewed. Although PG&E performed slightly better, it still did not meet its goals in two of the seven years. In recent years, the program portfolios for PG&E and SoCalGas have achieved their natural gas energy-savings goals partly because the CPUC reduced those goals by nearly 40 percent from 2019 to 2020. For example, the CPUC reduced PG&E’s natural gas energy-savings goal from 19 MMTherms in 2019 to 12 MMTherms in 2020.8 This decision was informed by a 2019 study that found energy savings gained from efficient lighting technologies indirectly affects efficiency programs’ potential natural gas energy savings, resulting in reduced potential energy savings that utilities could achieve. From 2016 through 2022, we found that the utilities’ program portfolios collectively exceeded their natural gas energy-savings goals by 9 percent, or by 23 MMTherms, which is equivalent to the annual natural gas use of more than 60,000 households. We display the actual electricity and natural gas savings by utility in Tables A.1 and A.2, and we demonstrate the greenhouse gas reductions associated with them in Tables A.3 and A.4 in Appendix A.
Although the CPUC lowered its energy-savings goals for electric and natural gas in 2020, the utilities’ program portfolios consistently met natural gas energy‑savings goals more effectively from 2020 through 2022 than they did the electric energy‑savings goals. In compliance with state law, the CPUC submits a report to the Legislature that compares the energy savings for each utility’s program portfolio to energy-savings goals for the previous three years. However, the most recent report, which covers the three-year period of 2018 through 2020, does not explain why the utilities’ program portfolios performed better in meeting natural gas energy-savings goals than in meeting electric energy-savings goals. Further, the CPUC does not have information readily available to explain why utilities’ program portfolios have met natural gas energy-savings goals more consistently than electric energy-savings goals. As a result, there was no information available for us to evaluate, and it is therefore unclear why these programs performed better in meeting energy‑savings goals.
We also found that the utilities’ program portfolios rarely achieved the CPUC’s calculation for cost-effectiveness. As we have explained, the CPUC’s measure of cost‑effectiveness for utilities’ program portfolios is a TRC value of 1 or higher, which indicates that the benefits the efficiency programs provide to utilities outweighed their implementation costs. However, as Table 4 shows, each of the four utilities’ program portfolios—for both electric and natural gas efficiency programs—fell short of achieving a TRC value of 1 or higher from 2012 through 2022, signifying that utilities’ program portfolios were rarely cost-effective. For example, in 2021 SCE’s program portfolio had a TRC value of just 0.22, failing to achieve the TRC value of 1, which would demonstrate cost-effectiveness. In other words, SCE’s program portfolio incurred costs that far exceeded the benefits the programs provided. As a result, approximately $65 million, or 78 percent, of the $83 million SCE spent in 2021 on efficiency programs in its portfolio did not produce any benefit according to the CPUC’s current method of measuring cost-effectiveness. Later in this report, we discuss our evaluation of the CPUC’s measurement of cost-effectiveness using the TRC.
To learn more about the utilities’ underperforming program portfolios, we evaluated the performance of individual programs by selecting 10 electric efficiency programs and 10 natural gas efficiency programs, for a total of 20 efficiency programs used by the four utilities. We obtained and reviewed efficiency program data from the CPUC, which utilities report to it, and selected efficiency programs for review according to factors such as program type, beneficiary type, annual budget, and amount of unspent funds. We found that few of these 20 programs met their projected energy savings from 2018 through 2022.9 We compared the projected energy savings of the selected efficiency programs to their actual energy savings to determine if the programs met those projected energy savings each year from 2018 through 2022. As Table 5 shows, most of the electric efficiency programs did not meet their projected energy savings, with six of these programs never meeting their respective projected energy savings. We present information about the reported energy savings, cost-effectiveness, greenhouse gas reductions, and average total annual bill savings for these programs in Tables A.5 and A.6 in Appendix A.
We also determined that the majority of the individual efficiency programs had TRCs of less than 1, meaning that the program costs outweighed the benefits. For example, the SDG&E efficiency program SW-COM Direct Install—which provides comprehensive energy audits, energy planning assistance, and no-cost or discounted energy efficiency improvements to small commercial customers—never achieved its annual projected energy savings over the five-year review period. In fact, it only achieved 31 percent of the projected energy savings in 2022 and had a TRC of just 0.44. The natural gas efficiency programs performed slightly better in achieving their energy‑savings projections than did the electric efficiency programs, although most natural gas efficiency programs still failed to meet their overall projected energy savings. Overall, the 20 programs that we reviewed cost ratepayers more than $51 million in 2022, but did not provide the savings or benefits that the CPUC or the utilities expected.10 From 2018 through 2022, we estimate the amount of missed energy savings for these 20 programs is equivalent to the annual electricity use of more than 22,000 households and the annual natural gas use of nearly 16,000 households.
The CPUC explained that programs may not achieve projected energy savings for various reasons. For example, the CPUC does not count the energy savings reported by utilities unless those savings are directly related to the existence of an efficiency program. EM&V studies validate the energy savings utilities report for selected efficiency programs, and the studies may find that a residence or business would have taken the same actions envisioned by the efficiency program independently, such as by replacing a water heater, even if that efficiency program did not exist. The studies can identify the number of these program participants to determine the amount of energy savings the utility reported that would have occurred regardless of the incentives offered by the program, such as a rebate for installing a water heater. In such an instance, although the utility had planned for and reported this program’s energy savings, the amount of savings associated with the program participants who would have taken action without the program are not counted. As a result, the actual energy savings achieved by the program are lower than planned and reported by the utility. This exclusion of certain energy savings could explain why some efficiency programs do not meet their projected energy savings, although the CPUC expects utilities to consider this type of effect when estimating an efficiency program’s energy savings.
Another reason that a utility’s efficiency program may appear to underperform is that the utility may use inaccurate assumptions to project an efficiency program’s energy savings. For instance, consider a utility that estimates the potential energy savings of a program that installs HVAC units based on historical data and projections. If the program encounters supply chain delays and cannot acquire and install as many units as it had planned for, the program may not achieve the projected total energy savings. Although we agree that utilities should use realistic assumptions in designing and operating their efficiency programs, a program’s poor performance could result from flawed program design and evaluation errors, rather than an inability to achieve energy‑savings. In the following sections of this report (here, and here), we discuss additional reasons efficiency programs frequently fail to achieve their goals, including significant shortcomings in the CPUC’s oversight of the effectiveness of efficiency programs.
Utilities Collected Much More Efficiency Program Funding From Ratepayers Than They Spent on Programs in 2022
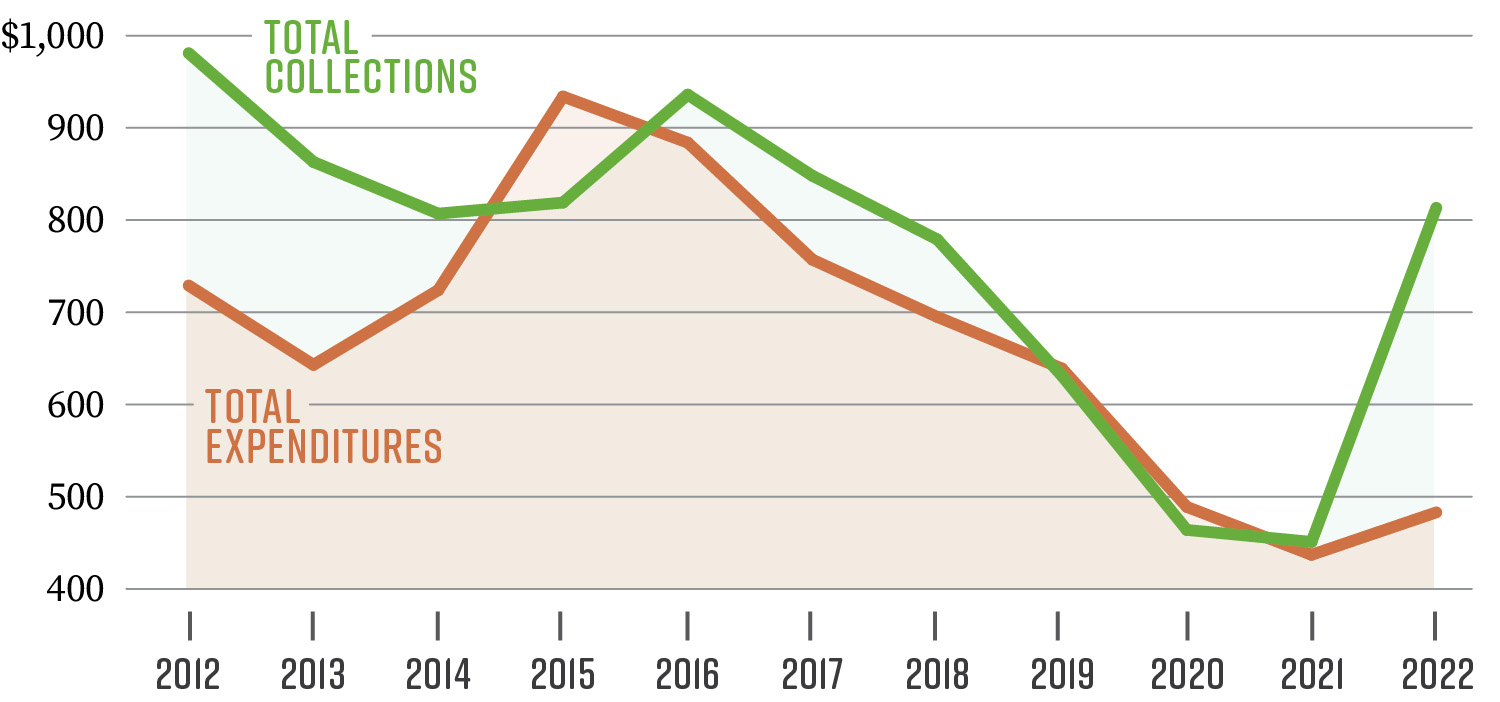
The CPUC authorizes utilities to collect funds from ratepayers to pay for efficiency programs, but it allowed utilities to collect hundreds of millions in ratepayer funds that the utilities did not spend in 2022. Figure 5 shows the difference between collections and spending across the audit period.11 In 2022 the four utilities spent only $425 million to implement efficiency programs out of the $812 million they collected for such programs. The utilities had also committed to spending, but had not yet spent, $92 million. Utilities can make such additional commitments to spend funds if, for example, they have a contract with a third-party implementer for an efficiency program that obligates the utility to pay for the program in the future. In these types of cases, the utility would report to the CPUC that the related funds are committed.
Figure 5
Utility Collections and Expenditures for Efficiency Programs Diverged in 2022
(in Millions of Dollars)
Source: CPUC and utilities’ data.
Note: We exclude collections associated with the CalSHAPE program, as those collected funds were not spent on efficiency programs.
Figure 5 is a line chart showing utility collections and expenditures, using separate lines, for efficiency programs diverged in 2022. In 2012, utilities collected $981 million for efficiency programs and spent $729 million on efficiency programs and came into greater alignment by 2014 until 2021. In 2013, utilities collected $863 million for efficiency programs and spent $643 million on efficiency programs; in 2014, utilities collected $807 million for efficiency programs and spent $724 million on efficiency programs; in 2015, utilities collected $819 million for efficiency programs and spent $934 million on efficiency programs; in 2016, utilities collected $936 million for efficiency programs and spent $884 million on efficiency programs; in 2017, utilities collected $848 million for efficiency programs and spent $757 million on efficiency programs; in 2018, utilities collected $779 million for efficiency programs and spent $695 million on efficiency programs; in 2019, utilities collected $631 million for efficiency programs and spent $639 million on efficiency programs; in 2020, utilities collected $464 million for efficiency programs and spent $489 million on efficiency programs; in 2021, utilities collected $515 million for efficiency programs and spent $437 million on efficiency programs; and in 2022, utilities collected $816 million for efficiency programs and spent $483 million on efficiency programs, creating a large gap between the amount collected and the amount spent. The source is CPUC and utilities’ data. Note: We exclude collections associated with the CalSHAPE program, as those collected funds were not spent on efficiency programs.
The remaining collected balance includes more than $236 million in unspent and uncommitted funds that utilities did not ultimately use—meaning that they over collected funds from ratepayers. This amount represents nearly 30 percent of the total funds utilities collected from ratepayers for efficiency programs in 2022.12 Utilities may have unspent and uncommitted funds when they fail to complete and execute contracts for a program, and as a result, the utility can no longer spend those funds for the intended purpose.
In interviewing staff and reviewing relevant documentation, we identified that SCE was responsible for a majority of the unspent funds and that the CPUC responded appropriately. In total, SCE represented about $167 million, or 71 percent, of the $236 million in unspent and uncommitted funds the four utilities collected from ratepayers in 2022, as Figure 6 shows. SCE found that it had trouble soliciting third‑party implementers for some of its programs. In 2024, CPUC staff created a plan with SCE that identifies several points of failure in SCE’s portfolio and potential corrective actions. Although we cannot disclose further detail about this corrective action plan and the issues it addresses because that information is confidential, we found that this plan includes several action items that addressed significant issues in SCE’s processes for overseeing third-party implementers. It will take additional time to determine whether the corrective action plan process is effective in reducing SCE’s unspent and uncommitted funds. By identifying the large amount of unspent and uncommitted funds, and working with the utility to take corrective action, we believe that the CPUC responded appropriately and provided sufficient oversight in this situation.
Figure 6
SCE Had the Largest Amount of Unspent and Uncommitted Funds in 2022
(in Millions)
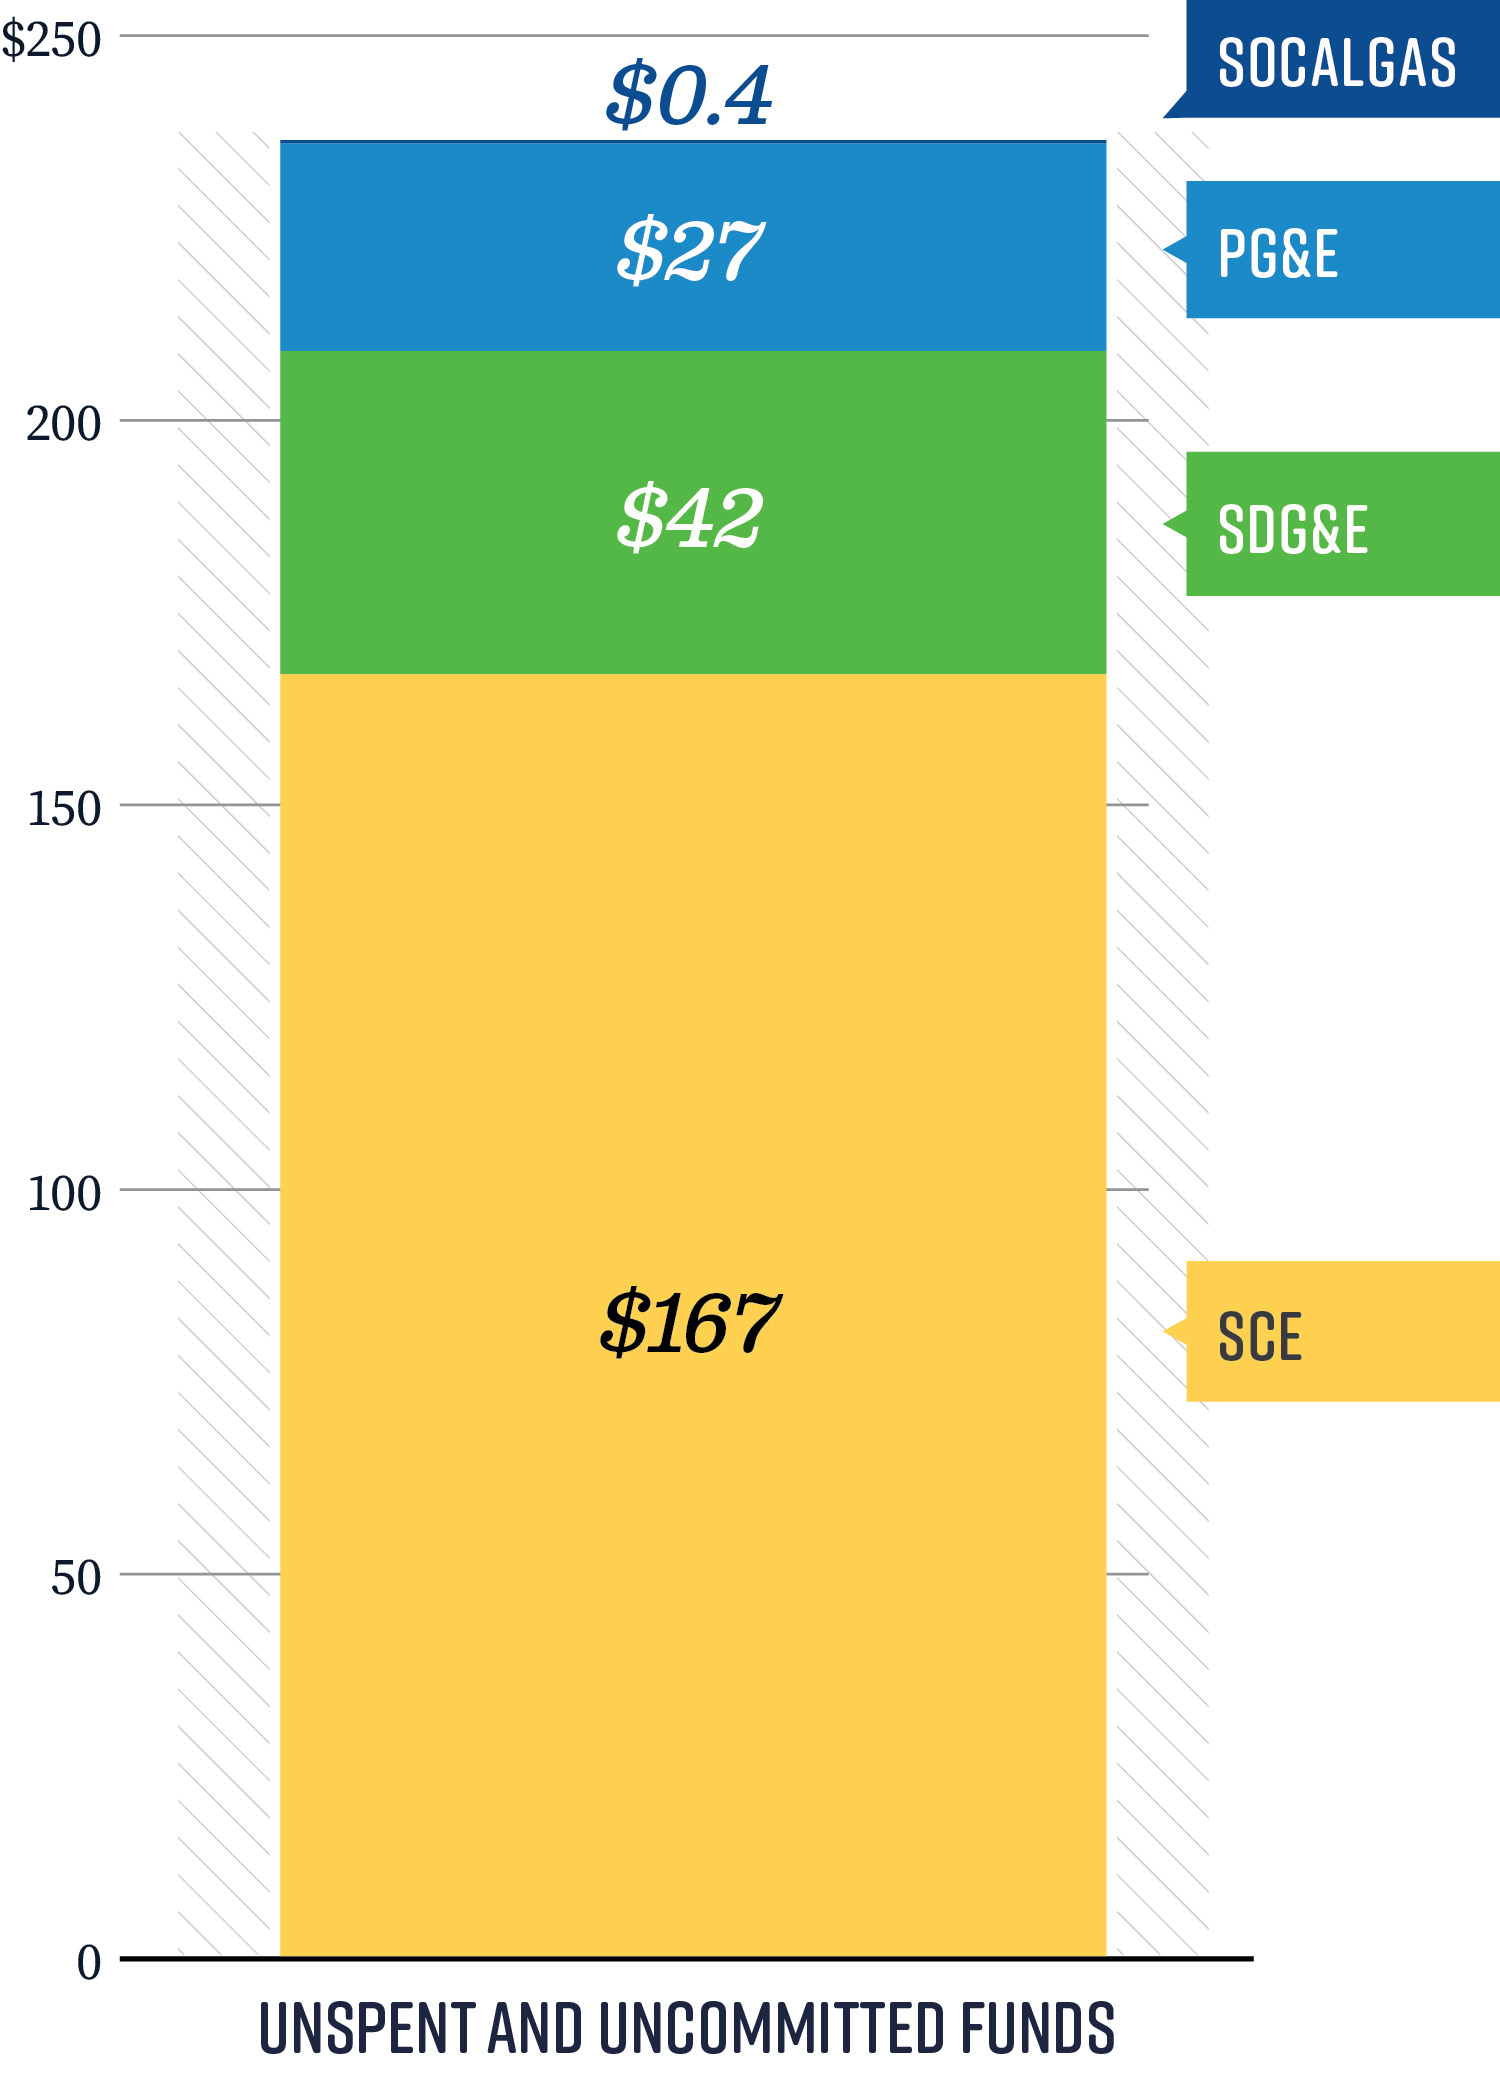
Source: Utility advice letters.
Figure 6 is a bar chart showing SCE had the largest amount of unspent and uncommitted funds in 2022. The bar chart is separated into the four major utilities we reviewed: SoCalGas, PG&E, SDG&E, and SCE. For 2022, SoCalGas had four hundred thousand of unspent and committed funds; PG&E had $27 million of unspent and committed funds; SDG&E had $42 million of unspent and committed funds; and SCE had $167 million of unspent and committed funds. The source is utilities’ advice letters.
We also reviewed the CPUC’s budget process to determine whether it could make improvements to reduce any utilities’ unspent and uncommitted funds. To determine the amount that utilities should collect from ratepayers, the CPUC uses a process of authorizing and approving utility budgets on a four-year cycle. First, each utility submits business plans to the CPUC detailing how each utility will spend funds on efficiency programs, summarizing costs at the program portfolio level, and describing information about program cost-effectiveness and contributions to energy-savings goals. Separately, the CPUC allows stakeholders, including ratepayer advocates, to analyze and scrutinize the utilities’ proposed costs and budget for operating each efficiency program. CPUC staff also analyze the budget requests by program segment, such as resource acquisition programs, and by economic sector to determine whether utilities’ requests are reasonable. Finally, after it considers the results of stakeholders’ analysis and its own analysis, the CPUC adjusts budgets proposed by the utilities. We did not identify any shortcomings in this process that may have contributed to the large amount of unspent and uncommitted funds in 2022. Instead, it appears that this was an isolated issue associated with one utility’s, SCE’s, management of its program portfolio.
The CPUC requires utilities to offset future collections in the amount of any unspent and uncommitted funds from previous years. We found that the CPUC has a process in place that identifies utilities’ unspent and uncommitted funds and adjusts the authorized budgets for utility program portfolios accordingly. As an example, if the utility reported $50 million of unspent and uncommitted funds from previous years and requested a budget of $300 million to fund its program portfolio, the CPUC would authorize the utility to collect only $250 million. To make ratepayers whole, the CPUC would maintain and not reduce the spending included in that request. We find this process is sufficient to ensure utilities do not collect more than needed, and therefore accumulate excess funds, from ratepayers.
An exception to the requirement that utilities offset future collections in the amount of any unspent and uncommitted funds occurred from 2020 through 2022. State law directed the CPUC to require utilities with program portfolios to fund CalSHAPE in part with any unspent and uncommitted efficiency program funds for those years. For example, in 2022, $236 million of unspent and uncommitted funds were allocated to fund CalSHAPE and not to offset the utilities collections in 2023.
The CPUC’s Lack of Appropriate Oversight Has Allowed Utility Program Portfolios to Underperform for Years
The CPUC is responsible for regulating the utilities and has broad authority to compel them to report to it information regarding their efficiency programs; thus, we expected the CPUC to actively review the performance of utilities’ efficiency programs and take appropriate action to ensure that utilities improve or cease operating underperforming efficiency programs. Instead, we found that the CPUC performs little substantive oversight and has allowed utilities to operate efficiency programs—in some cases for years—that fail to meet energy-savings goals and are not cost-effective. As a result, the CPUC could not explain why utilities’ efficiency programs continually fall short of expectations.
As an example of its limited oversight, the CPUC uses millions in ratepayer dollars to fund independent evaluation studies of efficiency programs, yet the CPUC takes no action to ensure that utilities implement the resulting recommendations aimed at improving program performance. Additionally, the CPUC’s methodology for calculating the cost-effectiveness of efficiency programs is flawed and may discourage utilities from adopting certain efficiency programs that may provide benefits to participants that the TRC does not account for. For example, programs that install more efficient residential appliances typically have higher participant costs, which makes those programs results appear to be less than cost-effective because they don’t calculate the value of the benefit the participant realizes. Without significant improvement to the CPUC’s oversight of utilities’ efficiency programs, the State lacks assurance that utilities are using ratepayer funds prudently, and the Legislature should consider requiring the CPUC to eliminate funding for chronically underperforming programs.
The CPUC Does Not Consistently Ensure That Utilities Take Corrective Action to Address Efficiency Programs That Fail to Meet Goals
The CPUC establishes energy-savings goals for each utility’s service territory, sets annual energy-savings goals, and expects utilities to develop their program portfolios to meet or exceed energy-savings goals and to be cost-effective. Accordingly, we expected the CPUC to determine annually, as part of its oversight, whether utilities’ program portfolios achieve energy-savings goals and are cost-effective and that it would require utilities to take corrective action for program portfolios that fall short. For example, if the CPUC reviews a utility’s program portfolio and finds that the utility has not met energy-savings goals or that it has a TRC value of less than 1, the CPUC should ensure that the utility takes action, such as by ceasing the operation of ineffective programs, to improve the portfolio’s performance. However, we found that the CPUC neither evaluates whether utility program portfolios achieve energy-savings goals or are cost-effective, nor ensures that utilities implement corrective measures to address these shortcomings.
The CPUC’s budget process does not address these expectations because it focuses on projected energy savings and cost-effectiveness—not on actual outcomes. Specifically, the CPUC explained that it approves a utility’s annual budget and the utility’s annual portfolio of efficiency programs in an effort to ensure that each utility’s program portfolio meets its energy‑savings goals and is cost-effective. A utility submits this planned portfolio of efficiency programs through a CPUC database, and the information includes budgeted costs and projected energy savings for those programs. The database processes the information utilities submit and automates cost‑effectiveness calculations. This process provides information about whether the utility’s program portfolio is projected to meet or exceed its energy‑savings goals and will be cost-effective overall. Accordingly, the CPUC reviews the information utilities submit, along with feedback from stakeholders, such as public advocates, before approving the utility’s budget and program portfolio.
A significant shortcoming in the CPUC’s approach is that it does not evaluate whether utilities’ program portfolios meet or exceed energy‑savings goals and are cost-effective at the end of each year, despite receiving information that would allow it to do so. Annually, utilities submit information to the CPUC that includes each efficiency program’s expenses, the utility’s claims of how much energy savings each program produced, and each program’s TRC value. We would expect that the CPUC would use this information to evaluate whether each utility’s program portfolio achieves its energy‑savings goals and cost-effectiveness; however, the CPUC does not do this. When we asked the CPUC about its evaluation efforts, it explained that from 2007 through 2013, it awarded utilities a financial incentive if they reported that their program portfolios met or exceeded energy‑savings goals. The CPUC stated that it would provide a financial incentive to utilities using a formula based on how well the utility reported that its program portfolio performed. Although we question whether these efforts rose to the level of a formal evaluation of the effectiveness of efficiency programs, in 2013 the CPUC eliminated this approach after finding it did not contribute to utilities performing better in meeting energy‑savings goals. Since that time, the CPUC has not developed an alternative method to assess whether each utility’s program portfolio meets or exceeds its energy‑savings goals. Furthermore, the CPUC explained that starting in 2021, some EM&V studies began reviewing the cost‑effectiveness of individual efficiency programs. However, these efforts do not evaluate the cost‑effectiveness of each utility’s program portfolio after each year.
The CPUC explained it does not retroactively assess whether each utility’s program portfolio meets or exceeds its energy‑savings goals or is cost-effective because it is focused on facilitating utility planning of program portfolios in future years. Consequently, the CPUC remains unaware of whether utilities achieve the envisioned energy savings and cost-effectiveness threshold, and therefore is ill-equipped to take action to direct utilities on the corrective actions they need to take to improve their program portfolio performance and address chronically underperforming efficiency programs. Instead, the CPUC explained that it is focused more on facilitating utility program portfolio planning in future years rather than monitoring past performance. The CPUC emphasized that utilities can best utilize the validated energy-savings data from EM&V studies through its database to facilitate planning their program portfolios in years ahead, rather than for its own monitoring of utility program portfolio performance. We agree that the utilities should use these data for program portfolio planning, but the CPUC is missing a significant opportunity to use these data to ensure utilities are operating effective program portfolios and using ratepayer funds prudently. For example, the CPUC—as a regulatory agency—could use its own validated data to determine which utilities failed to meet expected energy savings and direct those utilities to take corrective actions to adjust their program portfolios, rather than relying on utilities to use this information for only planning purposes.
The CPUC’s failure to evaluate the performance of utilities’ portfolios has three potential impacts. First, the CPUC cannot recognize program strengths and make recommendations for improvement, causing the State to lose potential energy savings that could further contribute to greenhouse gas reductions. Second, when utilities’ program portfolios are not cost-effective, ratepayer dollars are not available for use on other, potentially more effective programs. Third, utilities will continue to collect ratepayer dollars to fund program portfolios that are underperforming.
However, there has been some recent improvements to the CPUC’s oversight, albeit these improvements are minimal and in their infancy. Beginning in 2023, the CPUC asked each utility to present expenditures and energy savings at bi-monthly management meetings to assess whether each utility’s program portfolio is on track to meet their projected expenses and energy savings for the year. In one example, the CPUC determined that a particular utility’s spending and estimated energy savings for its program portfolio were relatively low, and that the portfolio was not on track to meet projections the utility established to achieve energy-savings goals and cost-effectiveness. The CPUC requested that the utility develop a corrective action plan outlining specific steps to improve the program portfolio’s performance and establish a timeline for implementing these improvements. The utility’s program portfolio has since shown improvement when comparing energy savings in the first six months of 2024 to the same time frame in 2023. However, the CPUC will not know the extent of improvement until it receives all the data for the second half of 2024 in early 2025. The CPUC’s recent steps to increase its oversight of utilities’ portfolios during regular, bi‑monthly meetings is a productive step and illustrates that proactive oversight is possible. If the CPUC deploys such an approach more broadly, it would be better positioned to monitor program portfolio performance throughout the year and provide utilities with valuable feedback. However, the CPUC has not formalized this process, such as through a commission decision, explaining the purpose of the bi-monthly meetings and the information it expects utilities to report regarding program portfolio performance.
Additionally, the CPUC does not comprehensively review the performance or cost‑effectiveness of all individual efficiency programs. As we described earlier, the CPUC expects utilities to develop their program portfolios to meet or exceed energy-savings goals and to be cost-effective. The CPUC does not view managing individual efficiency programs as part of its responsibility. Although it did point to some ad-hoc steps it has taken to collaborate and resolve obstacles utilities may face in implementing certain efficiency programs, it stated that utilities are ultimately responsible for the success of their program portfolios, including the individual programs included in those portfolios. We disagree with this perspective.
Because the CPUC does not review the performance of individual programs or require utilities to adjust or eliminate consistently underperforming programs, the CPUC risks utilities are not using ratepayer funds on the most effective efficiency programs. As we described earlier (here, and here), our review of a selection of 20 efficiency programs found that the programs generally did not achieve projected energy savings and were not cost-effective. The resulting cost to ratepayers can be significant given the efficiency programs often provide few benefits. For example, a SCE program that installs energy efficient products such as SMART thermostats and faucet aerators achieved only 23 percent of its projected electric energy savings and 21 percent of its projected natural gas energy savings from 2018 through 2022. Further, the program was only cost-effective in a single year of this five-year period. As a result, $19 million, or 58 percent, of the $33 million SCE spent from 2018 through 2022 on this efficiency program reportedly did not produce any benefit for ratepayers according to the CPUC’s current method of measuring cost-effectiveness. Had the CPUC regularly monitored program performance, it could have identified programs such as these that consistently underperform and required utilities to cease operating them or create and implement action plans to improve their performance. Such oversight would help ensure ratepayer funds are used judiciously and only on efficiency programs that achieve energy savings and are cost-effective.
Although the CPUC Spends Ratepayer Dollars to Evaluate Efficiency Programs, It Neither Tracks Nor Ensures That Utilities Implement the Evaluations’ Recommendations for Improvement
As mentioned previously, the CPUC conducts EM&V studies in part to evaluate the effectiveness of efficiency programs and make recommendations to improve them. These studies can serve a critical purpose, particularly by addressing the shortcomings in program performance, such as in those instances where efficiency programs do not achieve energy-savings projections. In multiple commission decisions, the CPUC has established that EM&V studies are required in order for the CPUC to provide oversight of utilities’ program portfolios. Every two years, the CPUC publishes a plan that describes the studies it will conduct and the selected programs it will evaluate. After utilities have implemented their efficiency programs, the CPUC uses a risk‑based approach to select a portion of programs to evaluate, prioritizing programs that claim the highest energy savings. The evaluations themselves do not align with the two-year cycle, as the CPUC publishes them as they are completed.
The CPUC funds EM&V studies by using fees collected from ratepayers on their energy bills. Four percent of each utility’s efficiency program budget, which utilities fund by collecting money from ratepayers, is reserved for EM&V studies. Although this proportion is small, the amount collected from ratepayers is not insignificant—in 2022 the four utilities reserved about $29 million to pay for EM&V studies. EM&V funds paid for the evaluation of 41 efficiency programs in 2022. Utility spending on those 41 programs represented nearly one-third of the total expenditures spent on all efficiency programs in that year. Given the investment in EM&V studies and the potential value they can provide to inform improvements to efficiency programs, we expected the CPUC to oversee utilities’ timeliness in responding to, and their implementation of, the resulting recommendations. However, we found it has not effectively done so.
The CPUC has not ensured that utilities respond to EM&V recommendations within the required time frame, risking that utilities are not promptly acting on recommendations to improve efficiency programs. Specifically, within 60 days of the publication of an EM&V study, the CPUC requires utilities to submit to it a response describing any action a utility has or plans to take to address the study’s findings and recommendations. We reviewed a selection of nine of the 36 EM&V studies published from 2020 through 2024 that included recommendations and required responses from utilities to determine what actions resulted from those studies’ findings and recommendations. Of the nine EM&V studies we reviewed, we found that the CPUC had not ensured that utilities submitted eight responses on time, with those response times ranging from one month to more than a year overdue. For example, a 2023 EM&V study of SoCalGas’s residential efficiency program recommended that the utility increase marketing of the program to expand participation and that it perform an assessment to determine the available market for a specific type of energy efficient water heater. Despite the potential improvements this recommendation could provide, SoCalGas did not submit the required response until the end of 2024—more than a year and a half after the study was published. When we asked the CPUC about the late responses, it could only explain that in two instances, the utilities requested extensions and that some utilities misinterpreted the requirement, which caused them to submit late responses.
A key contributing factor to utilities submitting responses late or not at all is that the CPUC lacks any process for monitoring the timeliness of responses. Such a process could include an alert to its staff that an upcoming response is due, the response due date, and a reminder to follow-up with the utility once that due date has passed. However, when we asked the CPUC why it had established the 60-day deadline for utilities to submit responses but had not developed a mechanism to ensure they complied with that deadline, it could not provide an explanation. Instead, the CPUC indicated that it sees value in formalizing a process to ensure utilities submit required responses on time. Without a process that tracks the timeliness of utilities’ responses to EM&V recommendations, any necessary improvements to efficiency programs could be delayed or not occur at all, potentially risking that ratepayer dollars are wasted.
Of greater concern is that the CPUC does not know whether utilities have implemented EM&V recommendations for efficiency program improvement. To identify whether utilities took the proposed corrective actions, we asked the CPUC to provide us with information on the recommendation status for the nine EM&V studies we reviewed. However, the CPUC could not provide this information because it does not track utilities’ implementation of recommendations. We expected such tracking to include the date of the study, the resulting recommendations, the utilities’ proposed corrective actions for each, reasoning for any rejection of the recommendations, and the CPUC’s assessment of the adequacy of the utilities’ actions to implement the recommendations. We found this lack of oversight concerning given the recommendations can be value‑added and the studies are paid for using ratepayer dollars. For example, an EM&V study published in 2021 of the emerging technologies program (ETP), which the utilities use to evaluate emerging and underutilized energy efficiency technologies for possible inclusion in utilities’ program portfolios, included key findings and recommendations to improve the ETP’s performance. One such recommendation was the need for increased coordination among utilities, the CPUC, and other stakeholders in implementing the program. However, when we asked the CPUC about the status of the recommendations, it did not know whether the utilities fully implemented the recommendations. In this instance, the CPUC may have missed an opportunity to ensure that utilities coordinated effectively to identify and implement efficiency technologies that ultimately could help ratepayers and save more energy.
When we asked the CPUC about why it had not established a process to track the status of utilities’ implementation of EM&V recommendations, it did not provide us with an explanation and instead pointed to recent efforts, with which we have concerns, that it has taken to increase its oversight. The CPUC noted that a recent decision requires utilities to submit formal responses separate from the required 60‑day responses, describing how they have incorporated or otherwise addressed only selected EM&V recommendations. Specifically, the CPUC explained that it and its contractors noticed instances where EM&V studies resulted in recommendations that were already included in previous studies or that were repeatedly rejected by utilities. As a result of these observations, the CPUC plans to require utilities to submit formal responses explaining the status of repeated recommendations or their reasoning for rejecting recommendations, such as those instances when the utilities disagree with the evaluator’s findings. The CPUC anticipates receiving utilities’ first formal responses in late 2025, after it identifies those recommendations that are repeated or rejected.
We have two primary concerns with the CPUC’s approach. First, the approach only applies to certain recommendations, and may exclude those that are most salient. Second, we are concerned about the CPUC’s planned approach to identify repeated or rejected recommendations. Specifically, given the CPUC does not track the status of utilities’ implementation of EM&V recommendations, we asked how it plans on identifying those recommendations that are repeated or rejected. The CPUC explained that it has largely relied on the institutional knowledge of current staff, consultants, and supervisors to identify such recommendations. This approach is flawed because the CPUC lacks any centralized tracking of repeated or rejected recommendations, meaning it could inadvertently exclude some from its review. Further, the approach does not take into account the potential loss of institutional knowledge due to staff turnover. Without an effective follow-up process on the status of all EM&V recommendations for programs that were selected for review, the CPUC cannot demonstrate to ratepayers the resulting value their investment in these studies provides, raising questions about whether it is using ratepayer funds judiciously.
The CPUC’s Flawed Method for Measuring Cost-Effectiveness Has Likely Discouraged Utilities’ Adoption of Alternative Approaches to Achieve Energy-Savings Goals
As we describe in the Introduction, state law requires the CPUC to identify all potentially achievable cost-effective electricity and natural gas efficiency savings for electrical and gas corporations, including the utilities we reviewed. The CPUC primarily measures cost-effectiveness through the TRC. The TRC value allows the CPUC to understand whether a program or portfolio of programs provides more benefits than costs, and is therefore cost-effective, by dividing program benefits by program costs, as Figure 2 in the Introduction shows. A TRC value of 1 or higher indicates that a program provides more benefits than costs, and a TRC value of less than 1 indicates that a program’s costs exceeds the benefits. This measure allows the CPUC to ensure that utilities responsibly allocate ratepayer funds and evaluate the cost-effectiveness of utilities’ efficiency programs.
We evaluated the CPUC’s TRC measure to determine whether its calculation met best practices. To do so, we researched best practices when designing cost‑effectiveness metrics for energy efficiency programs as well as practices in other states. These best practices for calculating cost‑effectiveness indicate that if an entity includes a cost in its benefit-cost calculation, it should include associated benefits. Ignoring this practice would result in costs unnecessarily outweighing benefits. For example, if the CPUC includes the costs to program participants, such as a business’s cost to purchase HVAC units, it should also include the associated benefits, such as the value of cleaner air in the business’s buildings. We describe examples of participant non-energy benefits that agencies can consider including in benefit-cost calculations like the TRC in the text box.
Examples of Non-Energy Benefits to Program Participants:
- Water and sewer utility savings.
- Reduced operation and maintenance costs.
- Health improvements.
- Employee productivity increases.
- Participant comfort.
Source: The National Energy Screening Project.
Despite these best practices, we found that the CPUC’s TRC calculation includes costs to program participants but does not include participant non-energy benefits. This imbalance in the TRC is particularly important for programs that install equipment, such as a new water heater, because those programs have greater participant costs, such as costs to purchase and install the equipment. Programs that install equipment may also provide greater non-energy benefits, such as increasing property values, than other types of programs. Table 6 provides a hypothetical example of the lack of participant benefits and its impact on the TRC for the hypothetical efficiency program. In this example, the hypothetical electric water heater installation program is not cost-effective, with a TRC of 0.93. By increasing benefits by an additional 15 percent to account for participant benefits, similar to Vermont’s practice for estimating non-energy benefits, this program would become cost-effective with a TRC of 1.07. Because the CPUC does not include participant benefits in the TRC calculation, the cost-effectiveness of efficiency programs that install equipment appears to be lower than it could be. Although the CPUC has not ensured utilities end programs that are not cost-effective, excluding participant benefits unnecessarily discourages utilities from adopting these programs, because it may impact the cost-effectiveness of their proposed portfolios that the CPUC must approve.
We identified a method of saving energy, called fuel substitution, which is susceptible to under-calculation of benefits by the CPUC and is therefore rarely used by utilities despite the benefits of efficiency programs that use this method. Fuel substitution involves replacing equipment that uses one fuel source with equipment that uses a different fuel source, such as replacing a gas water heater with an electric powered water heater. Fuel substitution methods reduce the overall consumption of natural gas and associated greenhouse gas emissions, and move California towards greater electrification, a statewide goal established by the Energy Commission. However, utilities rarely use these methods, possibly because the TRC’s calculation discourages it. We reviewed spending on fuel substitution by the utilities and found that from 2020, when the CPUC began recording such data, through 2022, spending on efficiency programs using fuel substitution comprised only 4 percent or less of annual expenditures. In total, the utilities we reviewed spent almost $14 million on efficiency programs using fuel substitution initiatives in 2022, compared with $483 million on all efficiency programs.13 Additionally, we found that since 2020, fuel substitution methods struggle to be cost-effective under the TRC’s current calculation. Specifically, fuel substitution methods had a TRC of 0.96 in 2020, 0.89 in 2021, and only 0.48 in 2022.
The cost-effectiveness of technologies and methods are a key consideration when the utilities construct their program portfolios and possibly helps to explain why utilities do not use fuel substitution more widely. Specifically, the CPUC requires utilities to submit cost-effective portfolios using approved methods to achieve energy savings, including fuel substitution methods, and decide on a mix of programs that will meet the CPUC’s required cost-effectiveness requirement. As a result, if fuel substitution methods are not cost-effective, meaning they fail to achieve a TRC value above 1, the utilities are naturally discouraged from using these methods, as fuel substitution would make their proposed portfolio less cost-effective overall. This issue affects the annual portfolios that utilities submit to the CPUC for its review and approval, because the CPUC only approves cost-effective portfolios.14 When we asked the CPUC why utilities are not adopting fuel substitution into their programs more widely, staff noted that fuel substitution could often involve high costs, such as the purchase of equipment and infrastructure upgrades to homes. This produces lower TRC values, particularly because it does not include participant benefits in the calculation, such as decreased operation and maintenance costs that new equipment provides. The inclusion of additional participant non-energy benefits would result in an overall increase in the TRC of efficiency programs that use fuel substitution methods, making these programs more attractive for utilities to include in their portfolios.
Many other parties raised similar concerns about the TRC to the CPUC, and we believe the CPUC did not adequately respond to these concerns by stakeholders. Specifically, when the CPUC established the TRC as the primary cost-effectiveness test in 2019, several parties, including advocates for ratepayers and environmental advocates, raised concerns to the CPUC about the lack of non-energy benefits in the TRC. A CPUC staff consultant white paper argued that the current TRC calculations address this concern, in part, by adjusting participant costs downward to account for some non-energy benefits. The utilities jointly argued that, in fact, the current TRC calculation methods do not properly account for participant non-energy benefits and that the adjustments to participant costs are inadequate. The CPUC ultimately made no change to the calculation of the TRC specifically regarding participant non‑energy benefits and did not provide an explanation for doing so in its decision.
When we followed up with the CPUC about its exclusion of participant non-energy benefits, it noted difficulty in estimating these benefits for inclusion in the TRC. However, we researched whether other states incorporate participant non-energy benefits in cost-effectiveness and found that certain other states have developed ways to incorporate estimates of such non-energy benefits. For example, Massachusetts includes participant non-energy benefits in its cost-effectiveness measure by estimating reduced operation and maintenance costs, increased health, safety, and comfort, and increased property values, among other benefits. Additionally, Vermont simply increases the estimated benefits of efficiency programs by 15 percent to serve as a surrogate for difficult-to-quantify non-energy benefits. While participant non‑energy benefits could be greater than the 15 percent increase Vermont uses, it is more appropriate to estimate these benefits than to exclude them altogether. Without corrections to the CPUC’s TRC calculation, the utilities are unlikely to submit program portfolios that include significant amounts of fuel substitution methods, ultimately hindering the State’s goal of electrification and the reduction of greenhouse gas emissions.
Other Areas We Reviewed
To address the audit objectives approved by the Joint Legislative Audit Committee (Audit Committee), we also reviewed the following:
- How the Energy Commission administered the School Energy Efficiency Stimulus Program (CalSHAPE).
- The distribution of efficiency program funding to identify how utilities are spending those funds in disadvantaged communities.
- The CPUC’s cost-effectiveness metric to determine whether it affects the demand for energy.
- Efficiency programs that provide incentives to program participants, which utilities refer to as pay-for-performance programs.
The Energy Commission Is Unlikely to Spend, and May Have to Return to Utilities, Nearly $200 Million When CalSHAPE Ends
In 2020 the Legislature passed a law establishing CalSHAPE, which the Energy Commission oversees, primarily to help school districts improve their HVAC and plumbing systems. To fund the program, state law redirected to the Energy Commission certain energy efficiency funds that utilities collected from ratepayers. CalSHAPE comprises two separate grant programs, one for HVAC improvements and another for plumbing improvements. School districts that needed to make improvements to their HVAC or plumbing systems could submit applications to the Energy Commission for either or both grants. State law requires the Energy Commission to allocate 75 percent of the program funds to the HVAC program and 25 percent to the plumbing program. Of the $983 million reserved for grant awards, the Energy Commission allocated $742 million for HVAC improvements and $241 million for plumbing improvements. As we discuss later, school districts requested significantly more funding for HVAC grants than they did for plumbing grants. Figure 7 shows the difference in funding for both grant programs, including the program’s remaining unspent funds, which state law requires the Energy Commission to return to the utilities by December 1, 2026.
To identify the Energy Commission’s key oversight responsibilities as they relate to CalSHAPE, we interviewed staff and reviewed program guidelines and records. We determined that the Energy Commission adequately designed and implemented the process to distribute grant funds to school districts. For example, state law requires that CalSHAPE program funds collected by each utility be used on projects located in that utility’s service territory. We reviewed the Energy Commission’s records and found that the Energy Commission designed its online system effectively by ensuring that it automatically assigns grant applicants to the appropriate utility fund based on the applicant’s geographic location.
Figure 7
CalSHAPE Provides More Funding for HVAC Improvements Than Plumbing
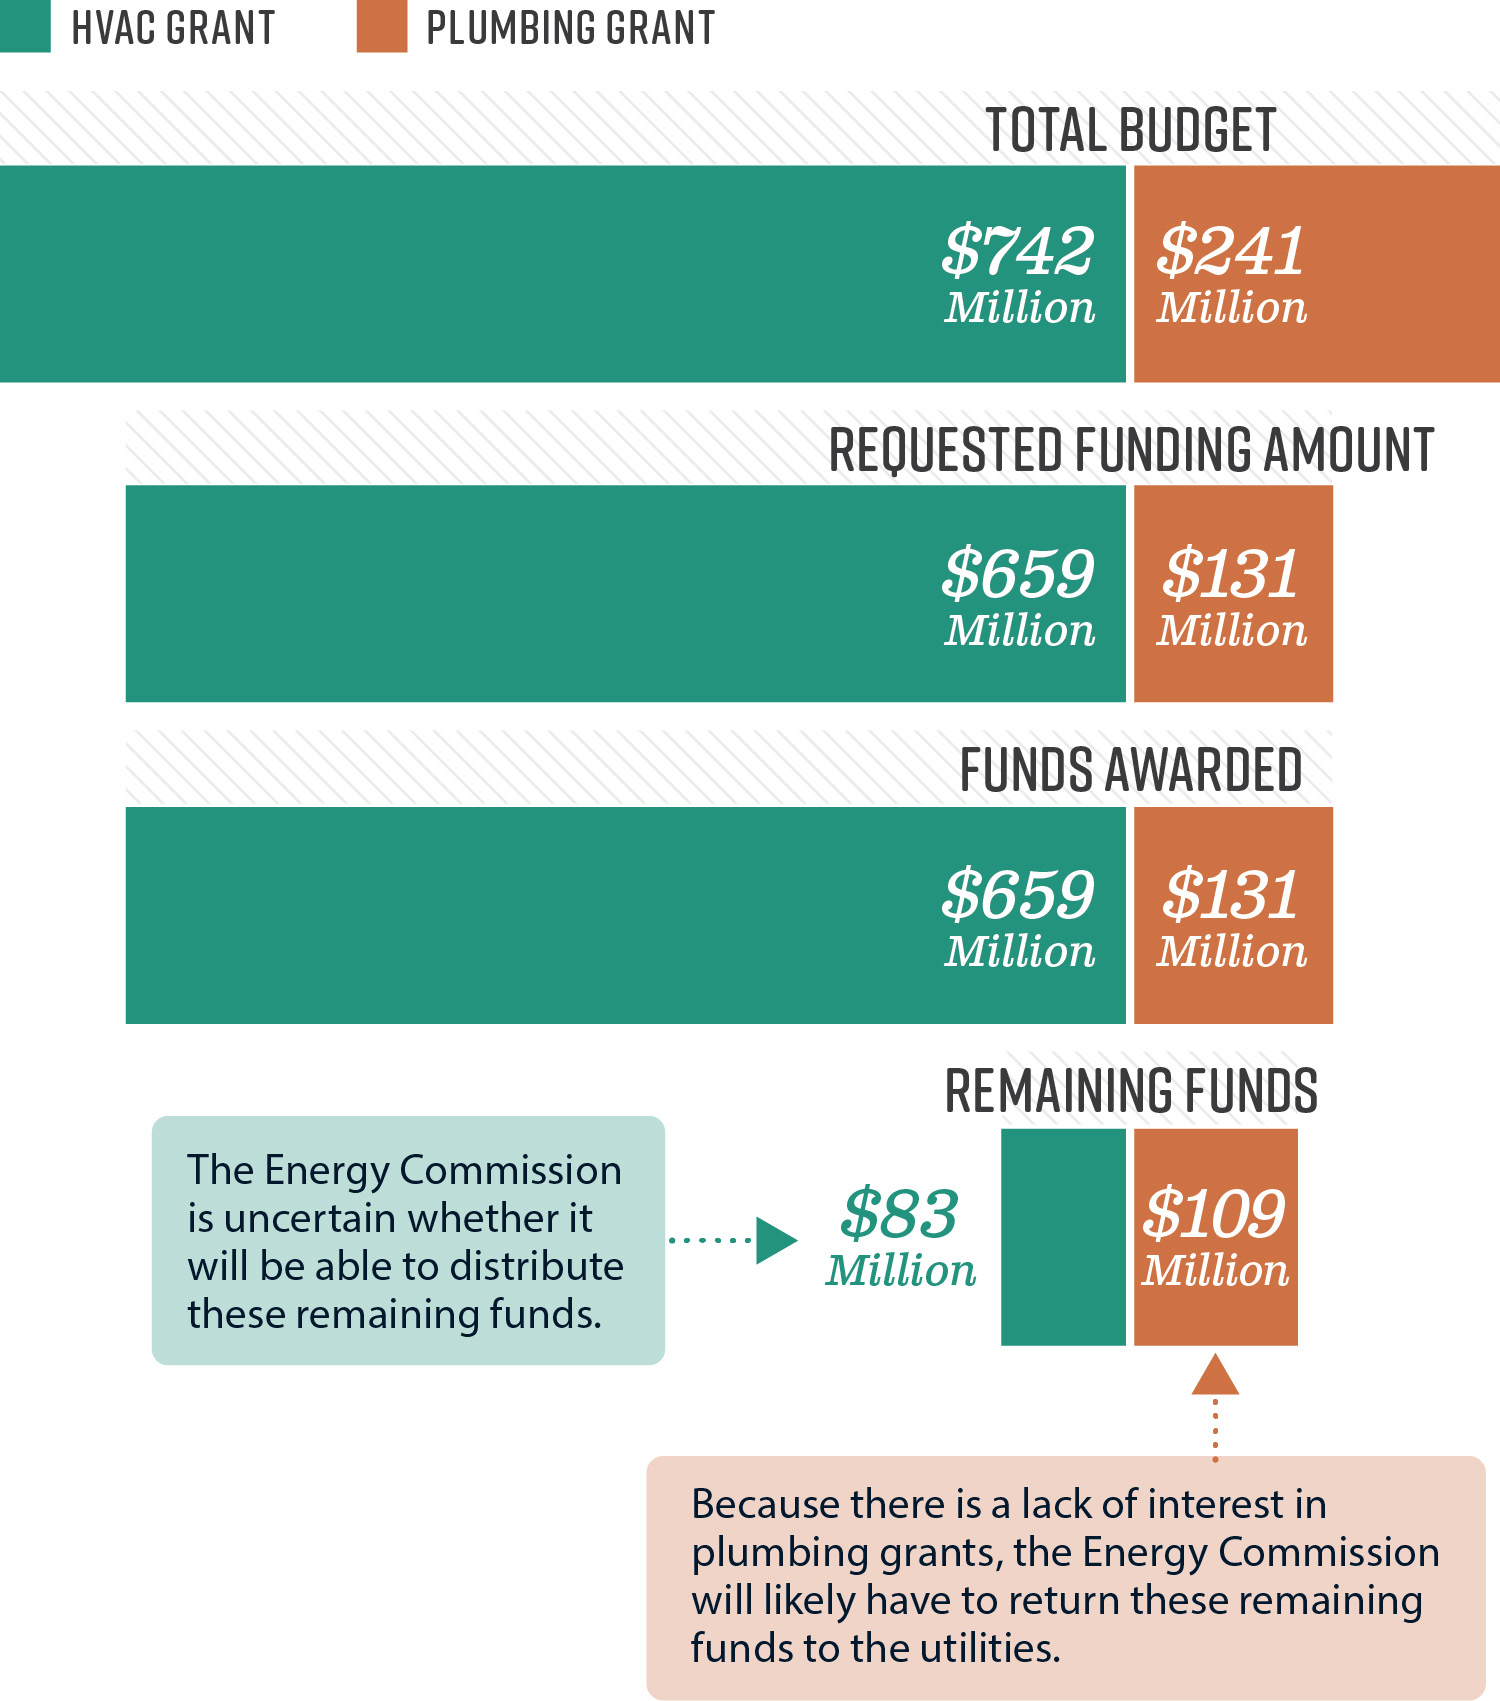
Source: CalSHAPE program documentation and interviews with the Energy Commission.
Note: Totals may differ slightly due to rounding.
Figure 7 is a bar chart showing that CalSHAPE provides more funding for HVAC improvements than plumbing and that there are about $200 million in remaining funds. The bar chart is separated into four categories: total budget, requesting funding amount, funds awarded, and remaining funds. The Energy Commission allocated $742 million for HVAC improvements and $241 million for plumbing improvements. School districts requested and the Energy Commission awarded $659 million for HVAC improvements and $131 million for plumbing improvements. The Energy Commission is uncertain whether it will be able to distribute $83 million of remaining funds for HVAC improvements. Additionally, because there is a lack of interest in plumbing grants, the Energy Commission will likely have to return $109 million of remaining funds for plumbing improvements to the utilities. The source is CalSHAPE program documentation and interviews with the Energy Commission. Note: Totals may differ slightly due to rounding.
The Audit Committee asked that we compare the CPUC’s process for overseeing its efficiency programs with the processes the Energy Commission uses to oversee CalSHAPE. However, as Figure 8 illustrates, because the CPUC does not directly administer utilities’ efficiency programs, its role in overseeing such programs is not comparable to that of the Energy Commission. Instead, utilities are responsible for administering the efficiency programs within their program portfolios with direction and very limited oversight from the CPUC. In contrast, the Energy Commission administers and oversees CalSHAPE without any involvement from the utilities, apart from providing a portion of its energy efficiency funds to the Energy Commission for its administration. The Energy Commission’s responsibilities include announcing funding for CalSHAPE, reviewing and approving applications for grant funds, and awarding grant funds to school districts—all of which are administrative functions that the CPUC does not perform. Because the CPUC does not administer efficiency programs or issue any type of grant funding to recipients, we cannot compare the Energy Commission’s administration of CalSHAPE to the CPUC’s role in overseeing efficiency programs.
Figure 8
Unlike the Energy Commission, the CPUC Does Not Administer Efficiency Programs
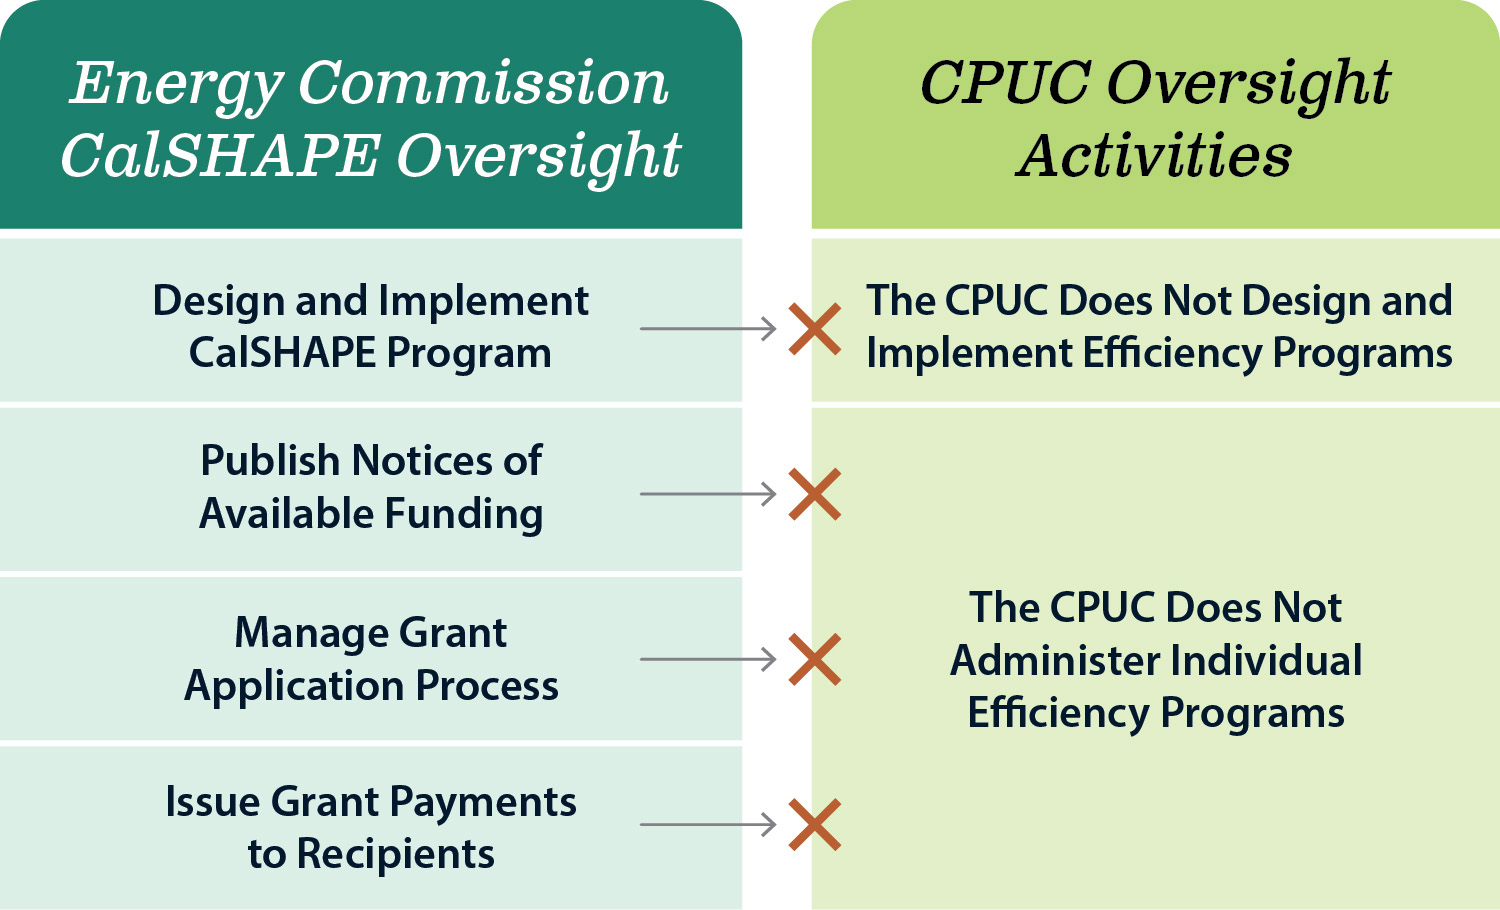
Source: State law, CalSHAPE program guidelines and public notices, CPUC energy efficiency documents and interviews.
Figure 8 is an image showing that unlike the Energy Commission, the CPUC does not administer efficiency programs. The Energy Commission’s oversight of CalSHAPE includes design and implementation of the CalSHAPE Program, publishing notices of available funding, managing the grant application process, and issuing grant payments to recipients. The CPUC’s oversight activities do not include designing and implementing efficiency programs, nor does the CPUC administer individual efficiency programs. The source is state law, CalSHAPE program guidelines and public notices, and the CPUC energy efficiency documents and interviews.
We found that the Energy Commission’s process for distributing CalSHAPE funds to school districts for the improvement of their HVAC systems has been lengthy, causing some school districts to be at risk of not completing all grant-funded improvement projects before October 31, 2026, which is the deadline the Energy Commission has set for districts’ final reporting. Even though the program does not end until January 1, 2027, the Energy Commission needs these three months to ensure that school districts do not have any unspent funds when the program ends because state law requires all unspent funds—those it has not awarded and those that the recipient school districts have not spent—to be returned to the utilities. The Energy Commission’s grants for HVAC improvements are in two parts, for which school districts must apply for and complete the associated requirements in succession, and it gives school districts two years to complete each grant agreement. The first is an assessment grant, which requires school sites to use licensed professionals to determine the HVAC improvements they need and to submit an assessment report to the Energy Commission. After school districts complete the first grant agreement, they can apply for the second grant, which they must use to pay for their HVAC improvement projects. The Energy Commission reported that it has distributed more than 1,100 grant awards to school districts on a partial‑reimbursement basis, meaning that the school districts must spend some of their own funds on these HVAC improvement projects and then request reimbursement from the Energy Commission.15 To receive CalSHAPE funding to actually complete HVAC improvements, a school district would need to have completed the assessment grant and applied for the second grant by June 2024. However, at that time, many school districts were still completing the required first assessment, and some had only recently applied for the assessment grant. The tight deadline means that those school districts and any later applicants are at risk of not completing projects before the program ends.
Further, the Energy Commission may not be able to distribute all grant funds to school districts for improvements to their HVAC systems before CalSHAPE funding is returned in 2026. In 2024, the Energy Commission reported to the Legislature that school districts would need to complete all HVAC projects by June 30, 2026 to avoid the December 1, 2026 deadline to return unspent funds. Therefore, the Energy Commission stopped accepting applications for ventilation funding on July 31, 2024, to ensure that school districts had two years to complete improvements. Awarding grants any later than that date may have allowed school districts to continue projects without assurance that they would spend all of their grant awards before the program ended. The Energy Commission also reported in 2024 that those school districts that immediately applied for HVAC program funding in 2021 had only just completed the required assessments of their HVAC systems and were applying for the second grant to make the necessary HVAC improvements. At the end of 2024, the Energy Commission had roughly $83 million in HVAC funds that it had not yet awarded. To ensure that school districts complete improvements before the program ends, the Energy Commission stated that it is providing technical assistance to school districts and communicating program requirements and timelines to address any delays. The Energy Commission believes that if it executes the HVAC program effectively—specifically, by providing technical support to schools, maintaining accurate accounting, and adhering to all statutory guidelines—it may be able to distribute the remaining funds before the deadline. Despite these efforts, it is still uncertain whether the Energy Commission will be able distribute all funding or whether schools will complete their improvements before the program ends.
Further, the Energy Commission has accumulated $109 million in unspent funds reserved for the plumbing program that it likely will not use before the program ends. School districts have not shown as much interest in plumbing grants as compared to HVAC grants. The Energy Commission suspects that many school districts already have low-flow plumbing fixtures and would not benefit from the program. However, we did not identify efforts that the Energy Commission has taken to extend the program after it distributed the final round of funding for plumbing grants in 2024. The Energy Commission determined that issuing additional funding rounds at this stage would not allow school districts enough time to complete projects within the allotted two-year period. State law does not permit the Energy Commission to use funds reserved for the plumbing program for HVAC grants. However, the Energy Commission expanded eligibility for plumbing grants to state agencies in 2022 and informed the Legislature that an expansion of the types of plumbing fixtures and appliances eligible for replacement would increase the number of school districts requesting plumbing grants. However, we did not identify any subsequent statutory changes to the types of plumbing fixtures and appliances eligible to be replaced under the plumbing program. Changing the percentage of program funds allocated to the plumbing program or expanding the list of plumbing fixtures and appliances eligible for replacement, both of which are set in law, would require legislative action, and the Energy Commission has not pursued changes to program guidelines in this area. Therefore, the remaining $109 million will likely remain unspent and then be returned to the utilities in 2026.
Utilities Spend Proportionate Amounts on Efficiency Programs in Disadvantaged Communities
The Audit Committee requested that we determine total funds spent through efficiency programs from 2012 through 2022 across census tracts, which are small geographic areas established by the U.S. Census, and to determine the amount of ratepayer funds spent to assist low-income Californians. Although we identified some concerns with the efficiency program spending data that utilities reported to the CPUC, which limited our ability to accurately analyze spending across census tracts, we identified the proportion of funds that utilities spent in disadvantaged communities.16 We identified such disadvantaged communities using criteria established in state law. State law requires the California Environmental Protection Agency (CalEPA) to use geographic, socioeconomic, public health, and environmental hazard criteria to identify these communities. To do so, CalEPA created the CalEnviroScreen mapping tool, which provides scores for each of California’s census tracts using 21 indicators, such as unemployment levels, air quality evaluations, and the amount of hazardous waste generators and facilities within each census tract. We used this information to identify whether utilities spent efficiency program funds in these areas and found that at least one-fourth of the total expenditures between 2012 and 2022 have been within disadvantaged communities. This is equal to the 25 percent of the State’s census tracts that the CalEPA has designated as disadvantaged communities. Therefore, we were able to determine that these communities are receiving a proportionate amount of utilities’ efficiency program spending.
The CPUC’s Cost-Effectiveness Metric Accounts for Energy Demand at Peak Hours
The Audit Committee directed us to evaluate whether the CPUC’s cost-effectiveness measure for efficiency programs—the TRC—takes into account and affects energy demand. To evaluate the measure and its impact on demand for energy, we examined how the CPUC calculates the TRC and determined whether the factors in that calculation related to the demand for energy. Specifically, we reviewed benefits in the calculation and found that the CPUC establishes certain monetary benefits for saving energy at various times of the day and year, which relates to the demand for energy at those times. To estimate these benefits, the CPUC created a calculator that assigns dollar values per megawatt hour to every hour in a year. This establishes the benefit, in dollars, of the energy not used at those times for inclusion in the TRC.
Because of the CPUC’s calculation methodology for the TRC, utilities’ programs achieve greater TRC values when the utilities save energy during peak hours. Specifically, the CPUC’s method for calculating benefits for the TRC—the avoided cost calculator—assigns greater dollar values during peak hours of energy use, which occur from 4 p.m. to 9 p.m. As a result, programs that save energy during the middle of the day provide less benefit in the TRC than do programs that save energy during peak hours. For example, if a program has a TRC value of 1.2 during the peak hours of energy use, that same program’s TRC value would be lower at other times and may not meet the cost-effectiveness threshold of 1 or higher.
Because the CPUC has incorporated benefits into the TRC for saving energy during times of peak energy use, and because utilities must operate program portfolios with a TRC of 1 or higher, the TRC encourages utilities to achieve energy savings during those hours of the day that have higher benefits, such as during peak hours. For example, the 2022 avoided cost calculator assigns $42.46 of benefit for each megawatt hour saved at 7 a.m. on September 15. On the same day at 7 p.m., the calculator assigned $94.47 for each megawatt hour saved. Therefore, utilities achieve greater benefit, and thus a greater TRC, by achieving energy savings at 7 p.m. during peak demand hours. Because the CPUC requires portfolios to be cost-effective, the CPUC is incentivizing utilities to save energy during higher value hours of the day to obtain greater benefits for their program portfolios. As a result, we conclude that the TRC can be a tool to reduce energy demand during peak hours.
Utilities Rarely Use Pay-for-Performance Efficiency Programs, Which Provide Financial Incentives to Ratepayers
Effective in 2016, state law directed the CPUC to require electrical and gas corporations to develop a program that provides financial incentives to customers to acquire products, services, or software that allows those customers to better understand and manage the energy usage in their homes or businesses. This statute does not establish a specified dollar amount of spending on such programs that utilities must meet. In 2017, the CPUC required utilities to implement pay‑for‑performance efficiency programs to meet the requirement. Pay‑for‑performance programs shift risk away from the utility to a third-party implementer because utilities only have to pay third-party implementers when the utility achieves an agreed-upon amount of energy savings. An example of such a program is PG&E’s Comfortable Home Rebates Program, which aims to save energy by installing energy efficient fixtures, including smart thermostats and attic insulation, in customers’ homes. The program implementer, Franklin Energy, only receives payment from PG&E when the program saves energy. However, despite the CPUC requirement, the utilities have not expanded the use of pay-for-performance programs significantly. For example, in 2022, utilities only spent $23.5 million on pay‑for‑performance programs, or 5.5 percent of the $425 million in ratepayer funds the four utilities spent on efficiency programs that year. Table B.2 in Appendix B shows that utility spending on pay-for-performance programs across all economic sectors has increased steadily from 2017 through 2022. The CPUC is uncertain why utilities have not more greatly expanded the use of pay‑for‑performance programs because it does not directly manage the program portfolios or review specific efficiency programs, as we describe in our Audit Results.
Recommendations
Legislature
To better ensure that energy efficiency funds are either used prudently or returned to ratepayers, and to ensure that the CPUC does not continue to authorize efficiency programs that do not meet energy-savings goals and cost-effectiveness measures, the Legislature should consider amending state law to require the CPUC to eliminate funding for chronically underperforming efficiency programs. For example, the Legislature could set the expectation that the CPUC will eliminate funding for certain efficiency programs that consistently fail to meet energy‑savings goals and are not cost-effective over a three-year period.
CPUC
To improve its oversight of the effectiveness of utility program portfolios and individual efficiency programs, the CPUC should begin monitoring the actual performance of utilities’ program portfolios and individual efficiency programs. Specifically, the CPUC should do the following:
- Annually evaluate the performance of each utilities’ program portfolios to determine whether they are achieving energy‑savings goals and are cost-effective.
- Require utilities to create corrective action plans when their program portfolios do not meet energy‑savings goals or are not cost-effective.
- Formalize, such as through a CPUC commission decision, its plans to hold bi‑monthly meetings with utilities and specify the information utilities must provide regarding the performance of their program portfolios. At a minimum, this information should include the progress utilities make in meeting energy‑savings goals and cost‑effectiveness of their program portfolios.
- Annually review the data utilities submit about energy savings and cost-effectiveness for all efficiency programs to identify those that are underperforming, including those that consistently fall short of goals.
- Work with utilities to determine why efficiency programs may be underperforming and propose corrective actions to address the causes of underperforming programs.
- End efficiency programs that consistently fail to meet cost-effectiveness or energy‑savings goals, such as by issuing a CPUC decision prohibiting utilities from using such programs in their program portfolios.
To ensure that it tracks the timeliness and status of utilities’ implementation of EM&V recommendations and to improve efficiency program performance, the CPUC should do the following by September 2025:
- Develop and implement a process to track and follow-up on the timeliness of utilities’ 60-day responses to recommendations. This tracking should include the EM&V publication date, the due date of the 60-day response, the date the CPUC received the response, and the follow-up that the CPUC took to ensure timely responses.
- As part of this process, track the status of utilities’ implementation of the recommendations. This tracking should include a utility’s proposed corrective actions and the CPUC’s assessment of the adequacy of the utility’s implementation of the recommendation.
- Memorialize this new tracking process in policies and procedures that detail how and when utilities should respond to recommendations and the actions the CPUC will take to follow-up on those responses.
By March 2026, using guidance from best practices and stakeholders, the CPUC should begin revisiting its consideration of participant non-energy benefits and costs in the TRC calculation, such as by including or excluding both factors in the calculation.
Energy Commission
To ensure that utilities use ratepayer funds effectively, the Energy Commission should by May 2025 create a plan to use all remaining CalSHAPE funds before the deadline in state law, such as by finding additional applicants or requesting that the Legislature change state law to allow the Energy Commission to return the leftover funding to utilities—and ultimately ratepayers—immediately.
We conducted this performance audit in accordance with generally accepted government auditing standards and under the authority vested in the California State Auditor by Government Code section 8543 et seq. Those standards require that we plan and perform the audit to obtain sufficient, appropriate evidence to provide a reasonable basis for our findings and conclusions based on the audit objectives. We believe that the evidence obtained provides a reasonable basis for our findings and conclusions based on our audit objectives.
Respectfully submitted,
GRANT PARKS
California State Auditor
March 18, 2025
Staff:
Jim Adams, MPP, Audit Principal
Chris Paparian, Senior Auditor
Shawn Butler
Kent Casimir
Cesar Rodriguez-Munoz
Data Analytics:
Ryan Coe, MBA, CISA
Aren Knighton, MPA
Legal Counsel:
David King
Appendices
Appendix A
Utilities’ Efficiency Program Portfolio Energy Savings, 2012 Through 2022
The Audit Committee directed our office to measure the electric and natural gas energy savings of efficiency programs from 2012 through 2022. Table A.1 presents information for electric energy savings in the program portfolios of the four utilities we reviewed. Table A.2 provides information about natural gas savings.
The Audit Committee also directed us to measure the greenhouse gas reductions provided by electric and natural gas efficiency programs from 2012 through 2022. We provide in Tables A.3 and A.4 breakdowns of reported greenhouse gas reductions in the program portfolios of the utilities we reviewed. To provide context for these reductions, nearly 500,000 metric tons of carbon dioxide (CO2) is equivalent to CO2 emissions from nearly 100,000 homes’ electricity use for one year.
The Audit Committee directed us to measure electricity savings, cost-effectiveness, greenhouse gas reductions, and total annual bill savings for a selection of efficiency programs from 2012 through 2022. As we describe in the Audit Results, we selected 20 efficiency programs to review in greater detail. We present in Table A.5 information about the reported electricity savings, cost-effectiveness, greenhouse gas reductions, and total annual bill savings for these programs. We provide the same information in Table A.6 for natural gas efficiency programs that we reviewed. For example, from 2012 through 2022, the SDG&E efficiency program SW-COM Direct Install—which provides comprehensive energy audits, energy planning assistance, and no-cost or discounted energy efficiency improvements to small commercial customers—reduced emissions by more than 50,000 metric tons of carbon dioxide (CO2), which is equivalent to the emissions associated with the electricity use of about 11,000 homes in a single year.
Appendix B
The Amount of Ratepayer Funds Spent Across Economic Sectors and Pay‑for‑Performance Programs, 2012 Through 2022
The Audit Committee directed us to determine the amount of ratepayer funds spent across various economic sectors from 2012 through 2022. Accordingly we present in Table B.1 the amount of ratepayer funds spent across the following economic sectors: public, commercial, residential, industrial, agricultural, and cross-cutting. The cross‑cutting sector represents spending directed to more than one sector, such as a program that assists both residential and commercial participants.
The Audit Committee also directed us to determine the amount of ratepayer funds spent on pay-for-performance programs from 2012 through 2022. However, the CPUC only began requiring utilities to have such programs in 2017. Efficiency programs that use pay-for-performance incentives provide payments to the third-party implementer that manages the program based on its performance delivering energy savings. For example, if an efficiency program does not lead to a reduction in energy use as planned, the utility will not provide full payment to the third-party implementer responsible for that efficiency program. Table B.2 presents the amount of ratepayer funds spent on pay-for-performance programs across the commercial, residential, industrial, and agricultural sectors.
Appendix C
Scope and Methodology
The Audit Committee directed our office to conduct an audit of the CPUC to determine what challenges it faces in administering energy efficiency funds and identify opportunities to improve efficiency program performance. Specifically, the audit committee requested that we review the CPUC’s process for prioritizing efficiency programs and evaluating the effectiveness of programs. The committee also asked us to determine whether the CPUC provides adequate oversight of efficiency program adoption and implementation. Table C lists the objectives that the Audit Committee approved and the methods we used to address them. Unless otherwise stated in the table or elsewhere in the report, statements and conclusions about items selected for review should not be projected to the population.
Assessment of Data Reliability
The U.S. Government Accountability Office, whose standards we are statutorily obligated to follow, requires us to assess the sufficiency and appropriateness of computer-processed information we use to support our findings, conclusions, or recommendations. In performing this audit, we relied on energy efficiency programs’ expenditure data obtained from the CPUC. To evaluate the data, we performed electronic testing and identified issues with address information in the data. Specifically, the data contained blank and invalid addresses, and we were unable to determine the location for about 26 percent of the expenditures. Consequently, we found the data to not be sufficient reliability for the purposes of determining precise amounts of expenditures in disadvantaged communities and because of this, we do not present spending by census tract in a table or graphic. As a result, we limited the level of detail we report by aggregating 11 years of data and provide this information with the caveat that it represents the lower limit of expenditures in disadvantaged communities. However, the amount of spending in disadvantaged communities could be higher. Specifically, we excluded any expenditures when we lacked confidence in accurately locating the appropriate census tract, although they may have been within disadvantaged communities. We also identified problems with the energy-savings goals in the data for 2012 through 2015, and therefore do not present those goals or information derived from them, such as energy-savings performance, for those years. Although we recognize that these limitations may affect the precision of the numbers we present, there is sufficient evidence in total to support our audit findings, conclusions, and recommendations.
Audit Responses
California Energy Commission
February 14, 2025 transmitted via email
Grant Parks, California State Auditor
California State Auditor
621 Capitol Mall, Suite 1200
Sacramento, CA 95814
Subject: 2023-127—Response to Draft Audit Report for CEC’s Oversight of the California Schools Healthy Air, Plumbing, and Efficiency Program
The California Energy Commission (CEC) appreciates the California State Auditor’s audit of CEC’s oversight of the California Schools Healthy Air, Plumbing and Efficiency Program (CalSHAPE).
We provide the following responses to the report findings and recommendations.
Summary of Findings:
The audit report states that:
- CEC may not be able to distribute all grant funds to school districts for improvements to their HVAC systems before CalSHAPE ends in 2026.
- CEC has accumulated $100 million in unspent funds reserved for the plumbing program that it likely will not use before the program ends.
Recommendation:
By May 2025, CEC should create a plan to use all remaining CalSHAPE funds before the deadline in state law, such as by finding additional applicants or requesting that the Legislature change state law to allow CEC to return the leftover funding to utilities—and ultimately ratepayers—immediately.
CEC’s Response to Findings and Recommendations:
① ② 1. Recommendations, pages 9 – 10. We agree that the CEC may not distribute all funds before the program ends. Pursuant to Public Utilities Code (PUC) Section 1615(f), the CEC shall return leftover funding to the utilities by December 1, 2026. The law is silent on requiring a request to the legislature to change to state law. CEC will follow legislative and Governor’s Office direction regarding the use of the remaining CalSHAPE funds.
① ③ 2. Plumbing outreach, pages 8 – 9. The audit report states that it ”did not identify any efforts that the [CEC] has taken to raise awareness among school districts about the [Plumbing P]rogram after it distributed the initial round of funding for plumbing grants in 2024.” The CEC did, however, make several efforts to raise awareness among school districts about the Plumbing Program including presenting information on the Plumbing Program at many public workshops, conferences, tradeshows, and webinars throughout the duration of the program to increase awareness, which includes, but is not limited to:
- Public workshops where information on the available funding, application process, and program requirements was presented.[1]
- Public notices of funding availability were sent to the CEC’s CalSHAPE email distribution list, which had almost 800 individual subscribers, and posted on the CEC webpage at the beginning of each of the five funding rounds (Fall 2021, March 2022, June 2022, December 2022, July 2023).[2]
- Individual meetings with stakeholders, including industry groups, contractors, county offices of education, and school districts.
- Outreach booth at the California School Boards Association Annual Education Conference in 2022 where we advertised both the Ventilation and Plumbing programs to over 1,000 attendees which included school board members, parents of students, teachers, and various school district employees.
- County of San Diego webinar in January of 2023 and the Sustainable Building Working Group (SBWG) webinar in February 2023 where we provided information on both Ventilation and Plumbing programs, as well as current issues applicants were facing during the application process.
- Coalition for Adequate School Housing Conferences in February 2023 and February 2024 where we discussed the funding available for both programs.
- Green Schools Summit in October 2023 where we presented about the funding available for both programs.[3]
① ④ 3. Oversight and Quality Assurance, page 6, paragraph 1. The audit report describes the CEC’s responsibilities in administering the CalSHAPE Program. Beyond the responsibilities mentioned, the CEC also provides oversight of ventilation and plumbing projects, which include quality assurance and quality control reviews of grantee’s projects, to ensure program requirements are met. On page 6, paragraph 1, CEC recommends the following edit, “The Energy Commission’s responsibilities include…approving applications for grant funds, providing oversight and quality control of retrofits, and distributing funds to schools. . . . ”
① ⑤ 4. Expanded eligibility to plumbing, page 9. The audit report states CEC expanded plumbing eligibility to state agencies. This expansion was done at statutory direction pursuant to PUC Section 1631. CEC recommends the following edit on page 9, first paragraph, “However, based upon statutory direction, the Energy Commission expanded eligibility for plumbing grants to state agencies in 2022….”
① ⑥ 5. Length of process, pages 6-7. The audit report states CEC’s lengthy process for distributing funds to school districts is the reason some school districts are at risk of not completing their ventilation grant project before the October 31, 2026, final reporting deadline. CEC staff believe this is an incomplete explanation of the administrative and implementation timeline that schools navigate. While there is a process for applying and receiving funds that takes time, some school districts are at risk of not completing the grant projects due primarily to the lengthy process for local education agencies to hire a contractor, perform the work, prepare documents, and submit final reports prior to the October 31, 2026, deadline, which was put in place to meet the statutory deadline to return unspent funds to the utilities. Below are several considerations for this section:
- ⑥ The CalSHAPE process was informed by stakeholders’ comments requesting additional time at various stages of the process to accommodate the administrative processes of schools. The initial draft of the program guidelines, presented at a scoping workshop on January 22, 2021, proposed a maximum 18-month project term with an additional 3-month term extension. The CEC received comments from industry groups, contractors, and school districts stating 18 months was not long enough to complete the assessment process and reporting required by the Ventilation Program. In response to these comments, the CEC extended the time frame to complete the grant work to 2 years with an option for a 6-month extension in the first edition of the program guidelines and an 18-month extension in the fifth edition of the program guidelines. Recently, contractors and school districts have requested additional time to complete project work.
- The CalSHAPE payment process was designed to efficiently distribute grant funds while maintaining good stewardship of public funds. The CEC issues 50 percent of the award upon execution of the grant agreement for the Ventilation Program, 25 percent when the initial reporting is submitted, and the final 25 percent is issued after the final reporting, including project cost invoices and receipts, is submitted. The CEC coordinated with the State Controller’s Office (SCO) to develop a streamlined process for issuing payments to ensure that funds are distributed as quickly as possible. At the time that a grant project reaches a payment milestone, program staff create an invoice for the grant award payment, the CEC’s accounting office schedules the invoice, and SCO is notified to begin their process for issuing a check.
① 6. Program budget, Pages 4 – 6. The audit report provides CalSHAPE budget information, including the amount of funding available for ventilation and plumbing grant awards. As shown in the latest CalSHAPE program budget table below, the program includes $19 million from the greenhouse gas reduction fund (GGRF), allocated by the California Budget Act of 2022, Section 2, Item 3360-101-3228, which are statutorily restricted to be used for the Ventilation Program Upgrade & Repair grants. The CalSHAPE Activities and Expenditures, Annual Report on Program Year 2024, which includes a detailed description of the program budget, grant awards, and remaining funding, will be available on the CalSHAPE Program webpage in the second quarter of 2025.
| CalSHAPE Program Budget (As of February 12, 2025) | |
| Plumbing | $240,960,161 |
| Ventilation | $722,880,504 |
| @Ventilation – GGRF | $19,000,000 |
| Administration | $31,000,000 |
| Total | $1,013,840,665 |
Thank you for this opportunity to respond to this draft report. Should you have any questions, please contact CEC’s Audit Director, Mindy Patterson at mindy.patterson@energy.ca.gov or (916) 980-7937.
Respectfully,
Drew Bohan
Executive Director
cc: Jennifer Martin-Gallardo, Deputy Executive Director, California Energy Commission
Amanda Martin, Deputy Assistant Secretary, Administration & Finance, California Natural Resources Agency
Christina Evola, Assistant Chief Council, California Energy Commission
Mindy Patterson, Audit Director, California Energy Commission
Deana Carrillo, Director, California Energy Commission
Jennifer Nelson, Deputy Director, California Energy Commission
Jonathan Fong, Program Manager, California Energy Commission
Blake Campbell, Energy Commission Specialist, California Energy Commission
Rosemary House, Administrative Assistant for Commissioner Gallardo, California Energy Commission
Lyndsay Jackson‐Ross, Administrative Assistant to Chair Hochschild, California Energy Commission
[1] See, e.g., https://www.energy.ca.gov/programs-and-topics/programs/california-schools-healthy-air-plumbing-and-efficiency-program-0; and https://www.energy.ca.gov/events/past-events?field_program_target_id%5B167%5D=167&field_event_type_target_id=All.
[2] See, e.g., https://efiling.energy.ca.gov/Lists/DocketLog.aspx?docketnumber=20-RENEW-01
[3] See https://www.rateitgreen.com/green-building-resources/sustainable-building-events/green-ca-schools-and-higher-education-summit/6624
Comments
California State Auditor’s Comments on the Response From the California Energy Commission
To provide clarity and perspective, we are commenting on the Energy Commission’s response to our audit. The numbers below correspond to the numbers we have placed in the margin of its response.
① When delivering the draft report to the Energy Commission we included only the portions relevant to it in a redacted draft. Therefore, the page numbers that the Energy Commission cites in its response do not correspond to the final report
② We are disappointed that the Energy Commission implies that it will not implement our recommendation. Specifically, as we describe here and here, the Energy Commission has accumulated $109 million in unspent funds reserved for the plumbing program that it will likely not use before the deadline to spend program funds on December 1, 2026. Nothing precludes the Energy Commission from requesting the Legislature change state law to allow it to return this leftover funding to utilities—and ultimately ratepayers—earlier than the deadline. Therefore, we stand by our recommendation that the Energy Commission create a plan by May 2025 to use all remaining CalSHAPE funds before the deadline in state law, such as by finding additional applicants or requesting that the Legislature change state law to allow the Energy Commission to return the leftover funding to utilities immediately.
③ During the course of the Energy Commission’s review of our draft report, we updated our report text to clarify that the Energy Commission has not taken action since distributing its final round of funding in 2024, rather than after its initial round of funding.
④ Our description of the Energy Commission’s responsibilities is not intended to be all encompassing, and is only meant to give examples of its responsibilities in administering the CalSHAPE program. Thus, we did not make any changes to our report text as the Energy Commission recommends.
⑤ The Energy Commission incorrectly implies that state law required it to expand eligibility for the plumbing program to state agencies in 2022. On the contrary, state law requiring it to extend eligibility for plumbing grants to state agencies became effective one year earlier in 2021. Thus, we did not make any changes to our report text as the Energy Commission recommends.
⑥ We disagree with the Energy Commission’s assertion that some school districts’ lengthy processes—not its own for distributing funds—place them at risk of not completing their ventilation grant projects before the deadline. As the entity required by state law to administer the CalSHAPE program, we expected the Energy Commission to use feedback it received from stakeholders and make adjustments to its distribution of funding, such as by seeking changes to the spending deadline, to provide school districts with enough time to comply with program requirements. Instead, to help school districts meet this deadline, and as we state, the Energy Commission is only providing technical assistance to school districts and communicating program requirements and timelines to address spending delays. Thus, we stand by our conclusion.
California Public Utilities Commission
February 14, 2025
Grant Parks
California State Auditor
621 Capitol Mall, Suite 1200
Sacramento, CA 95814
CALIFORNIA PUBLIC UTILITIES COMMISSION RESPONSE TO CSA AUDIT (2023-127) – ENERGY EFFICIENCY PROGRAMS AUDIT
Dear Grant Parks:
The California Public Utilities Commission (CPUC) provides our response to the draft report findings of the California State Auditor’s (CSA) report entitled Energy Efficiency Programs Audit.
Californians have been saving energy and money through energy efficiency for decades. California’s programs led by the CPUC consistently rank at the top of the American Council for an Energy Efficiency Economy’s national standings for state energy efficiency policies and programs that save energy, advance fairness, and produce environmental and economic benefits.
The CPUC is also continuously seeking ways to limit increases or reduce ratepayer costs and bills. We appreciate CSA’s focus on cost-effective energy efficiency in the report, because we are pursuing the same goal.
There are broad changes happening in the energy efficiency marketplace as California pursues additional, harder-to-achieve energy savings. Broadly speaking, ratepayer-funded energy efficiency programs provide rebates for cost-effective and energy efficient technologies that are novel when first introduced into the marketplace. Consumers use the rebates to be the first to try out the technologies. Within months or a few years, consumer adoption brings technologies like LED lighting into wide availability at competitive prices. Once adoption is sufficiently widespread and the market grows robust, the California Energy Commission (CEC) can adopt more stringent building codes and standards incorporating the technologies.
These market changes have benefited Californians, who save energy and money. At all points in the journey of market transformation for numerous appliances, devices, and building technologies, the CPUC always presses utilities, industry, and the private sector to innovate so that ratepayer-funded programs deliver cost-effective energy savings.
The challenge is to keep finding such opportunities once the easiest technology standards are moved into code. Heat pump technologies are examples of technologies undergoing intentional efforts at market transformation today.
California’s values of fairness also drive the CPUC to ensure that we distribute resources fairly among Californians, which means managing programs that deliver energy efficiency to people, small businesses, and communities for whom affordability presents a significant barrier. Such programs do not always yield the highest cost-effectiveness scores, yet are an important piece of delivering the benefits of saving energy and money to all Californians.
As the CSA report points out, these policy and program designs have implications for the cost-effectiveness of energy efficiency programs.
The CPUC is Adapting Energy Efficiency to California’s Changing Needs as Climate Change Impacts the State
① As California’s needs change, so do our programs. In 2024, after an extensive public stakeholder process, the CPUC switched to a new energy efficiency metric that values long term benefits such as the avoided cost of energy over the efficient equipment’s lifetime. This is called the Total System Benefit—it recognizes the long-term benefits that the equipment delivers, as well as the fact that homes and businesses using such equipment help California keep the lights on during our more-frequent heat waves that stress the electric grid. We anticipate that our portfolio of programs will have produced $533 million in Total System Benefits in 2024. In addition, our energy efficiency programs are expected to deliver 3.9 million metric tons of lifecycle CO2 reductions and 14.6 million metric tons of lifecycle CO2 reductions from building codes and standards.
The CPUC is committed to the continuous improvement of its operations. The CPUC appreciates the work performed by the CSA and the opportunities for improvement. The CPUC will establish a corrective action plan and timelines toward implementing the recommendations identified in this report as set out in our response below.
If you have further questions, please contact me at (415) 757-7844.
Sincerely,
Rachel Peterson
Executive Director
Enclosure
cc: Alice Reynolds, President
California Public Utilities Commission
Christine Hammond, General Counsel
Legal Division
Angie Williams, Director
Utility Audits, Risk and Compliance Division
Recommendation 1: Annually evaluate the performance of each utilities’ program portfolios to determine whether they are achieving energy savings goals and are cost effective.
CPUC Response: ☒ Agrees ☐ Disagrees with the recommendation or partially agrees.
The CPUC agrees and will implement this recommendation.
CPUC staff will assign a team to annually evaluate the performance of each utilities’ program portfolio to determine if energy savings goals are met and if the portfolio is cost effective. Starting with the next program year, CPUC staff will create a portfolio spreadsheet of evaluated performance. Based on this first year, CPUC staff will develop a cadence and frequency of the evaluation performance spreadsheets going forward.
Recommendation 2: Require utilities to create corrective action plans when their program portfolio does not meet energy savings goals or are not cost-effective.
CPUC Response: ☒ Agrees ☐ Disagrees with the recommendation or partially agrees.
The CPUC agrees and will implement this recommendation.
Using the analysis completed from Recommendation 4, CPUC staff will create a memo based on 2024 quarterly data and report program Total System Benefit targets versus reported Total System Benefit, by utility. The memo will also include the end of year Total Resource Cost (TRC) ratio by utility. The memo will highlight programs where Total System Benefit was not met and if the portfolio TRC is less than 1. CPUC staff will meet to discuss the memo results with the utilities at the next scheduled bi-monthly (every two months) meeting. After that meeting, CPUC staff will request the utilities to confirm the results from the memo and either develop a corrective action plan to address deficiencies in their portfolio or describe in their annual report their strategies to achieve their 4-year Total System Benefit and cost effectiveness goals. The corrective action plan will have timelines to fix the deficiencies.
Recommendation 3: Formalize, such as through a CPUC commission decision, its plans to hold bi-monthly meetings with utilities and specify the information utilities must provide regarding the performance of their program portfolios. At a minimum, this information should include the progress utilities make in meeting energy savings goals and cost effectiveness of their program portfolios.
CPUC Response: ☒ Agrees ☐ Disagrees with the recommendation or partially agrees.
The CPUC agrees and will implement this recommendation.
Beginning in 2020, CPUC staff have conducted bi-monthly (every two months) meetings with PGE, SCE and jointly with SCG/SDGE. To formalize these meetings, CPUC staff will reach agreement with each utility on the schedule of these meetings for 2025 and will maintain the schedule of recurring meetings. CPUC staff can require, as a standing item, that each meeting begin with a presentation of the programs meeting energy savings goals and an analysis of the current drivers of cost effectiveness of their portfolios. CPUC staff will create an internal share point folder to store the agenda and materials for each of these bi-monthly meetings, starting with the next bi-monthly meeting after the audit report is public.
Recommendation 4: Annually review the data utilities submit about energy savings and cost effectiveness for all efficiency programs to identify those that are underperforming, including those that consistently fall short of goals.
CPUC Response: ☒ Agrees ☐ Disagrees with the recommendation or partially agrees.
The CPUC agrees and will implement this recommendation.
CPUC staff can utilize 2024 quarterly reports that are available on the California Energy Data and Reporting System (CEDARS) website. CPUC will assign staff to create a comparison table of programs that generate energy savings and compare the Total System Benefit forecasts for 2024 by utility to the 2024 year-end Total System Benefit reported on CEDARS. While the CPUC adopts goals at the portfolio-level and not at the program-level, this will create an initial indication of performance compared to 2024 Total System Benefit forecasts.
For cost effectiveness, CPUC staff will utilize 2024 quarterly reports that will be available on CEDARS. CPUC staff will add a portfolio level cost effectiveness result for 2024 by each utility. This process will continue annually.
Recommendation 5: Work with utilities to determine why efficiency programs may be underperforming and propose corrective actions to address the causes of underperforming programs.
CPUC Response: ☒ Agrees ☐ Disagrees with the recommendation or partially agrees.
The CPUC agrees and will implement this recommendation.
As part of Recommendation 3 (every two-month meetings) and the corrective action plans created from Recommendation 2, CPUC staff and the utilities will have the opportunity to discuss underperforming programs in more detail. From the meetings in Recommendation 3, CPUC staff will assign a team to work with each utility once programs have been identified as underperforming, per Recommendation 2. This team will track and follow up on corrective actions as appropriate.
Recommendation 6: End efficiency programs that consistently fail to meet cost-effectiveness or energy savings goals, such as by issuing a CPUC decision prohibiting utilities from using such programs in their program portfolios.
CPUC Response: ☐ Agrees ☒ Disagrees with the recommendation or partially agrees.
The CPUC cannot implement this recommendation as written but agrees with its spirit and will take the steps identified below to partially implement it.
The CPUC notes the existing rules of the energy efficiency program do not grant CPUC staff the authority to end a specific program. Only an order from the Commission can require the utilities to end a program or set rules on when programs must be terminated. And the Commission can only consider this type of order substantially changing the rules of the energy efficiency program in a formal proceeding. In addition, based on the CPUC’s quasi-judicial structure and legal requirements, the Commission cannot commit to a particular proceeding outcome in advance. Instead, the Commission must fairly make its decision based on the arguments and record made by parties in the proceeding. As a result, the CPUC cannot commit to implement this recommendation as written.
However, the CPUC agrees that programs that consistently underperform should be reviewed and ended absent other compelling circumstances and will implement steps to do so. Based on the outcomes of Recommendations 2-5, CPUC staff will work with the utilities to identify programs that may be removed from the portfolio through an existing procedural mechanism, and why. This process can be documented publicly as required by Decision 21-05-031, Ordering Paragraph 12: “All energy efficiency program administrators shall file a Tier 2 advice letter when opening a new program or closing an existing program.” In addition, CPUC staff will develop a proposal for consideration in a CPUC proceeding on how to identify consistently underperforming programs and options for program conclusion.
Recommendation 7: By September 2025, develop and implement a process to track and follow-up on the timeliness of utilities’ 60-day responses to recommendations. This tracking should include the Evaluation, Measurement and Verification (EM&V) publication date, the due date of the 60-day response, the date the CPUC received the response, and the follow-up that the CPUC took to ensure timely responses.
CPUC Response: ☒ Agrees ☐ Disagrees with the recommendation or partially agrees.
The CPUC agrees and will implement this recommendation.
CPUC staff will use the evaluation reports issued in 2024 and the program administrators’ corresponding responses to recommendations for each of those reports to develop the template required for this recommendation. CPUC staff will create a spreadsheet that includes the EM&V publication date, the due date of the 60-day response, and the date the CPUC staff received the response. CPUC staff will include a column for CPUC follow-up. Once this template is created with 2024 impact evaluations, CPUC staff will test the template with any upcoming published response to recommendations. CPUC staff will make refinements if necessary and complete the tracking by September 2025. CPUC staff will store the response to recommendation tracker on a CPUC related website.
Recommendation 8: As part of this process, by September 2025, track the status of utilities’ implementation of the recommendations. This tracking should include a utility’s proposed corrective actions and the CPUC’s assessment of the adequacy of the utility’s implementation of the recommendation.
CPUC Response: ☒ Agrees ☐ Disagrees with the recommendation or partially agrees.
The CPUC agrees and will implement this recommendation.
CPUC staff will compile the program administrators’ responses to recommendations submitted during the 2024 year. The program administrators utilize a common template that lists the recommendations and how the program administrator responded. CPUC staff will assign a team to determine the adequacy of the utility response and develop follow-up steps and tracking tools for CPUC staff to ensure the recommendation is implemented.
Recommendation 9: By September 2025, memorialize this new tracking process in policies and procedures that detail how and when utilities should respond to recommendations and the action the CPUC will take to follow up on those responses.
CPUC Response: ☒ Agrees ☐ Disagrees with the recommendation or partially agrees.
The CPUC agrees and will implement this recommendation.
In the process of creating the trackers and templates for Recommendations 7 and 8, CPUC staff will develop a procedures checklist for both internal and external staff. This procedures checklist for how and when the utilities should respond to recommendations will be stored on the CPUC energy efficiency website, and available to program administrator staff as a resource. The procedures and guidance for actions the CPUC may take to follow up on those responses will be developed in tandem with Recommendation 8 and added to the CPUC’s EM&V training materials.
Recommendation 10: By March 2026, using guidance from best practices and stakeholders, the CPUC should begin revisiting its consideration of participant non-energy benefits and costs in the TRC calculation, such as by including or excluding both factors in the calculation.
CPUC Response: ☒ Agrees ☐ Disagrees with the recommendation or partially agrees.
The CPUC agrees with and will implement this recommendation.
CPUC will begin revisiting its consideration of participant non-energy benefits and costs in the energy efficiency cost effectiveness calculation by March 2026. CPUC staff will analyze guidance from best practices and receive feedback from stakeholders and will develop a proposal regarding how to consider participant non-energy benefits and costs.
Comment
California State Auditor’s Comment on the Response From the California Public Utilities Commission
To provide clarity and perspective, we are commenting on the CPUC’s response to our audit. The number below corresponds to the number we have placed in the margin of its response.
① We appreciate that the CPUC introduced a new metric to measure the value of energy savings in 2024. Because it was adopted by the CPUC after the period of our review, which was from 2012 through 2022, we do not discuss Total System Benefit in our report.
- The Audit Committee directed the California State Auditor to identify total expenditures on efficiency programs from 2012 through 2022, which was the most recent year that complete expenditure information was available. Accordingly, we report total expenditures that include more than just the four utilities in the figure. In all other cases, excluding Figures 3, 4, and 5 and Table B.1, we identify spending only by the four utilities. This aligns with our analysis of their energy savings and cost-effectiveness. The four utilities make up the vast majority of total expenditures, such as in 2022 when these utilities spent $425 million on their programs, which represented 88 percent of total expenditures. ↩︎
- Energy-savings goals are expressed in terms of saving gigawatt hours (GWh) of electricity and saving million-therms (MMTherms) of natural gas. ↩︎
- At the time of our audit, the most current and accurate energy efficiency data available was for the year 2022. ↩︎
- These funds include the utilities’ unspent and uncommitted funds for efficiency programs. Additionally, the utilities transferred a portion of the difference between the budget the CPUC authorized for efficiency programs and the budget utilities request for their programs. As an example, in 2021, if the CPUC authorized a utility to collect $100 million, but the utility only requested a budget of $80 million for efficiency programs, the utilities were required to collect from ratepayers and transfer to the Energy Commission 80 percent of the difference, or in this example, $16 million. ↩︎
- The Joint Legislative Audit Committee (Audit Committee) directed the California State Auditor to identify total expenditures on efficiency programs from 2012 through 2022, which was the most recent year that complete expenditure information was available. Accordingly, we report total expenditures that include more than just the four utilities we reviewed. In all other cases, excluding Figures 3, 4, and 5 and Table B.1, we identify spending only by the four utilities. ↩︎
- The U.S. Energy Information Administration collects, analyzes, and disseminates independent and impartial energy information to promote sound policymaking, efficient markets, and public understanding of energy and its interaction with the economy and the environment. ↩︎
- The Audit Committee requested that we review the effectiveness of a selection of efficiency programs from 2012 through 2022; however, during our review of available data and documentation, we identified concerns with the energy‑savings goals for 2012 through 2015, which we describe in Appendix C. Thus, we focused our review of whether utilities’ program portfolios met or exceeded energy‑savings goals for the period 2016 through 2022. ↩︎
- SDG&E’s natural gas energy‑savings goal remained unchanged at 2 MMTherms from 2019 to 2020. ↩︎
- Because the CPUC sets energy‑savings goals for utilities’ program portfolios and not for individual programs, we evaluated these programs compared to projections of the amount of energy they could save. ↩︎
- We present in Appendix A, Tables A.5 and A.6, additional details on the 10 electric and 10 natural gas efficiency programs we reviewed, respectively, including their overall cost-effectiveness. ↩︎
- Figure 5 includes total collections and total spending for all efficiency programs. In the following text, we identify the amounts associated with the four utilities we reviewed. ↩︎
- This calculation does not include funds that utilities collected and transferred to the Energy Commission for CalSHAPE. ↩︎
- Because the utilities or third-party implementers inconsistently reported data on the number of installations, such as by providing the weight of the appliances instead of the number of appliances installed in the reporting system, we were unable to identify the number of installations associated with this spending. ↩︎
- As we discuss previously, the CPUC does not review portfolios at the end of each year to ensure the utility did achieve the proposed energy savings. ↩︎
- The Energy Commission issues a portion of the total grant award to school districts when it initially approves a school district’s application. The Energy Commission only issues a final disbursement of the grant award to a school district when it submits a final report and supporting documentation for approval to the Energy Commission. ↩︎
- We explain in Appendix C our concerns about the data and that we were unable determine the census tract of about 26 percent of expenditures. We only considered expenditures that we were confident were located in a single census tract. ↩︎
