
2023-123 California’s Systems of Public Higher Education
Streamlining the Community College Transfer Process Could Increase Access
to Bachelor’s Degrees
Published: September 24, 2024Report Number: 2023-123
September 24, 2024
2023‑123
The Governor of California
President pro Tempore of the Senate
Speaker of the Assembly
State Capitol
Sacramento, California 95814
Dear Governor and Legislative Leaders:
As directed by the Joint Legislative Audit Committee, my office conducted an audit of the State’s three systems of public higher education: the California Community Colleges (CCC), the California State University (CSU), and University of California (UC). Our assessment focused on these systems’ efforts to improve the rate of community college transfers to CSU and UC. In general, we determined that streamlining the community college transfer process could increase students’ opportunities to earn bachelor’s degrees.
Although most transfer students who applied to CSU and UC gained admission to at least one campus in those systems, CCC students still struggle to transfer. Only about 1 in 5 students who began community college from 2017 to 2019 and intended to transfer did so within four years, and transfer rates were even lower for students from certain regions and demographic groups. The vast majority of students who did not transfer never reached the point of applying to CSU or UC, mainly because they had not earned enough units. The three systems could help increase transfer rates by improving the outreach and support they provide to transfer-intending students. For example, CCC could ensure that students receive counseling and develop education plans so that they have a clear roadmap for transferring. The three systems could also share data about transfer students to help campuses make more targeted outreach efforts. Additionally, for students who earn enough units to transfer, CSU and UC could facilitate access to their preferred degree programs by ensuring that competitive campuses and majors adequately prioritize transfer applicants for admission.
Another barrier to transfer is the variation in transfer requirements across and within the three systems, which makes the process difficult for students to navigate. The Associate Degree for Transfer (ADT) offers a streamlined transfer pathway to CSU. However, community colleges may not offer every ADT, CSU campuses may not accept every ADT, and UC has established its own transfer options that lack some of the ADT’s key benefits. Expanding the use of the ADT—or the use of a UC option that emulates its benefits—would further streamline the transfer process.
Respectfully submitted,
GRANT PARKS
California State Auditor
Selected Abbreviations Used in This Report
| ADT | Associate Degree for Transfer |
| ASSIST | Articulation System Stimulating Interinstitutional Student Transfer |
| CCC | California Community Colleges |
| C-ID | Course Identification Numbering System |
| CSU | California State University |
| EOPS | Extended Opportunity Programs and Services |
| FERPA | Family Educational Rights and Privacy Act of 1974 |
| GPA | grade point average |
| STEM | science, technology, engineering, and mathematics |
| TAG | Transfer Admission Guarantee |
| UC | University of California |
Summary
Results in Brief
Each of the State’s three systems of public higher education—the California Community Colleges (CCC), the California State University (CSU), and the University of California (UC)—plays a critical role in helping Californians attain bachelor’s degrees. Since the publication of the Master Plan for Higher Education in California in 1960, the State has sought to develop and strengthen pathways for students to transfer from community colleges to CSU and UC campuses. Nevertheless, the transfer process remains difficult for students to navigate for a variety of reasons, including differences among the State’s three higher education systems.
The State’s Three Higher Education Systems Have Struggled to Meet Some Key Goals Related to Student Transfers
Only about 21 percent of community college students who began college from 2017 to 2019 and intended to transfer did so within four years, and transfer rates were even lower for students from certain demographic groups and regions of the State. Of the students who reached the point of applying to CSU or UC, more than 90 percent of CSU transfer applicants and more than 75 percent of UC transfer applicants gained admission to at least one campus in those respective systems, demonstrating relatively broad access for transfer students. However, transfer applicants’ access to competitive campuses and majors was more limited, which CSU and UC could address through additional monitoring to ensure that these campuses and majors are adequately prioritizing transfer students for admission.
Variations in Requirements Across and Within the Three Systems Add Significant Complexity to the Transfer Process
Students who intend to transfer from California’s community colleges must navigate a complex series of decisions related to varied CSU and UC requirements, especially if those students are considering multiple campuses or majors. To try to minimize this complexity, the Legislature and the three higher education systems have designed specific transfer options. For example, the Associate Degree for Transfer (ADT) offers a streamlined transfer pathway to CSU campuses, as well as other benefits. However, this option’s impact is lessened because each community college may not offer every ADT, and each CSU campus may not accept every ADT. Further, UC has not yet widely adopted the ADT model. Instead, it has established its own transfer options that do not provide the same level of benefits as the ADT does.
The Three Systems Could Better Facilitate the Transfer Process by Increasing Outreach and Support
Outreach and support from all three systems are key to ensuring that community college students can successfully transfer. Nonetheless, the five community colleges we reviewed had some weaknesses in their processes for supporting students to help them transfer. Further, although CSU and UC have existing programs and methods for advising community college students about the transfer process, these efforts do not reach all transfer‑intending students. Expanding data sharing among the three systems would help improve their outreach efforts.
Agency Comments
The CCC Chancellor’s Office, the CSU Office of the Chancellor, and the UC Office of the President indicated they would take action to implement our recommendations. Because we did not make recommendations to the specific campuses we reviewed, we did not request them to respond.
Introduction
Background
During the past several decades, the attainment of a bachelor’s degree has become increasingly associated with positive outcomes, such as higher income and lower unemployment rates. According to a March 2023 report from the Public Policy Institute of California, a worker with a bachelor’s degree in California in 1990 earned an average of 39 percent more than one with only a high school diploma. In 2021, this difference had grown to 62 percent. Moreover, research suggests that California will face a significant lack of college‑educated workers within the next decade. To address such concerns, the Governor set a goal in 2022 to increase the percentage of working‑age Californians who have a postsecondary degree or certificate from 55 percent to 70 percent by 2030.
Although some students attend private universities, eight out of every 10 college students in California attend a public institution in one of the State’s three systems of higher education: the California Community Colleges (CCC), the California State University (CSU), and the University of California (UC). Figure 1 shows these systems’ sizes, roles, and degree types. As we discuss in the sections that follow, all three systems are critical to creating paths for Californians to attain college degrees.
Figure 1
California’s Three Systems of Higher Education Are Intended to Serve Different Purposes
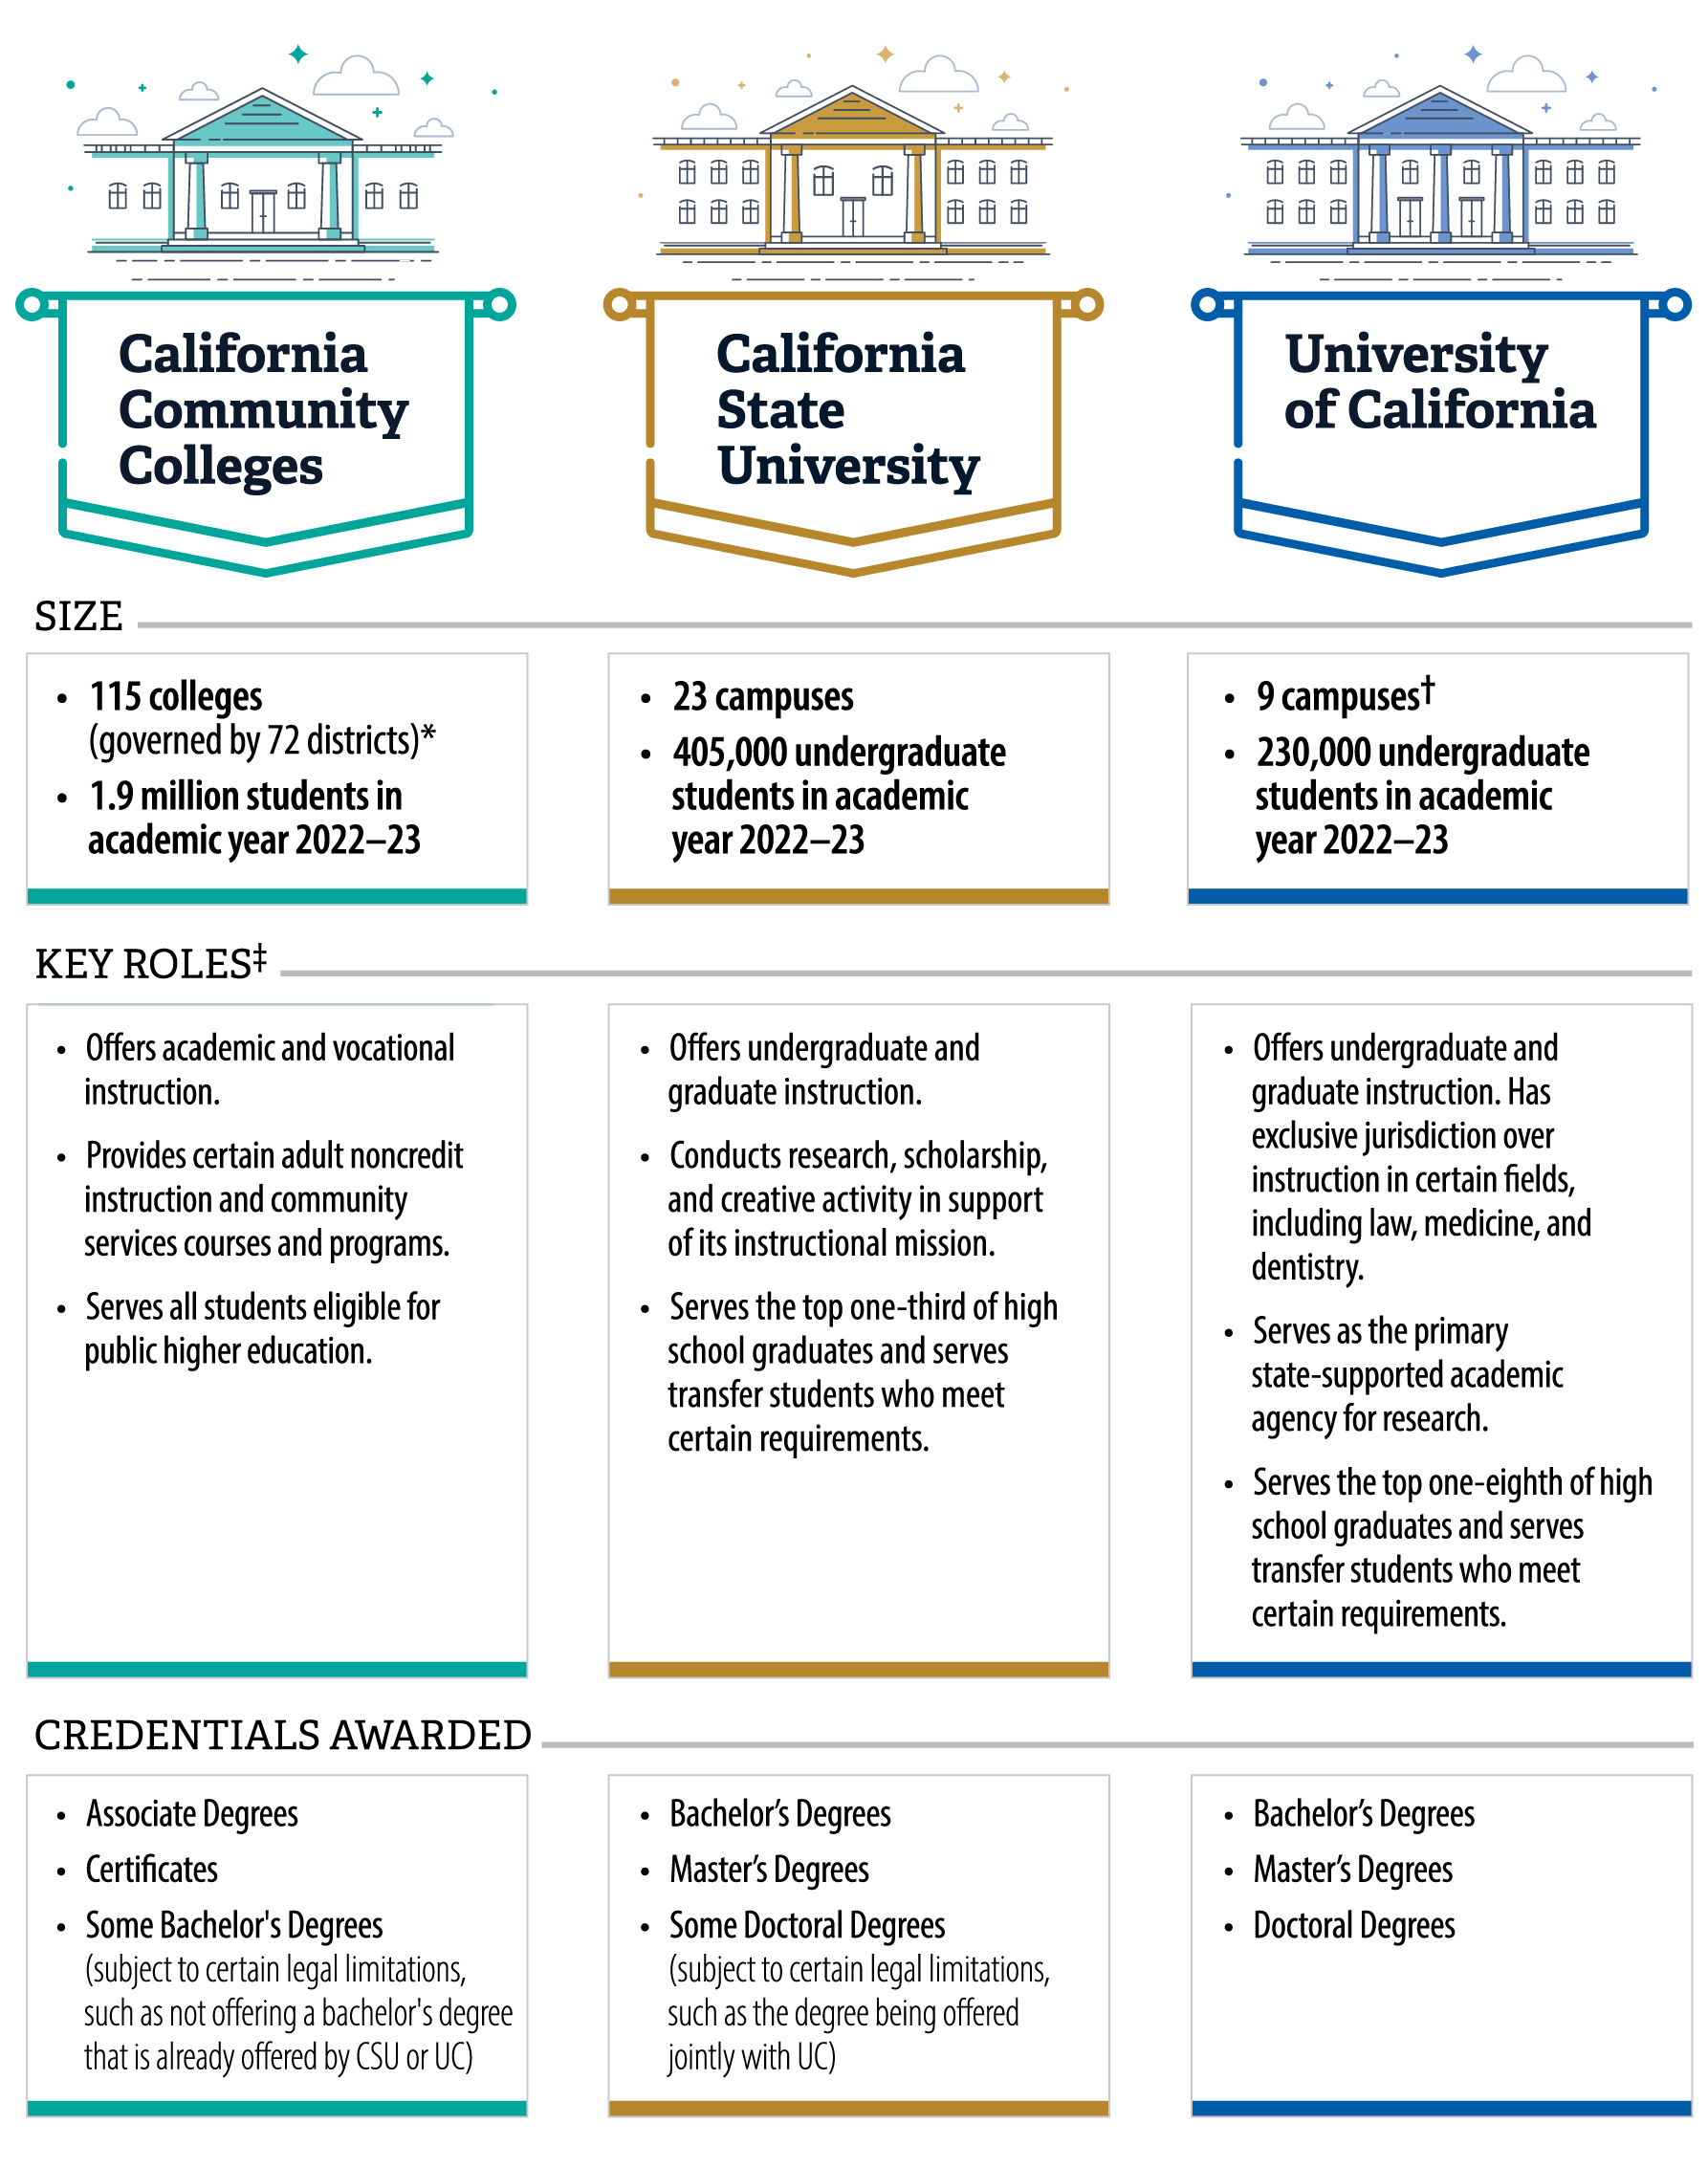
Source: State law, the Master Plan, and reports and data from the systems about their campuses and undergraduate populations.
* We have not included Calbright College, a fully online public community college, because it does not offer courses that transfer to other colleges, nor does it confer associate degrees.
† We have not included the University of California, San Francisco, because it does not provide undergraduate instruction.
‡ The 1960 Master Plan envisioned these roles, including that UC would accept community college transfer students with at least a 2.4 GPA and that CSU would accept transfer students with at least a 2.0 GPA. In practice, transfer admissions requirements can be complex, as we discuss in Chapter 2.
Figure 1 is a vertical chart that describes basic details about and explains the key roles of each of California’s three systems of public higher education: the California Community Colleges, the California State University, and the University of California. The California Community Colleges is the largest system, consisting of 115 colleges and serving 1.9 million students in academic year 2022-23, whereas the California State University has 23 campuses and served 405,000 undergraduate students, and the University of California has nine campuses and served 230,000 undergraduates. The figure also shows that community colleges offer academic and vocational instruction to all students eligible for public higher education and generally award associate degrees and certificates. The California State University and University of California offer undergraduate and graduate instruction and generally award bachelor’s degrees, master’s degrees, and doctoral degrees.
The Master Plan for Higher Education in California
Published in 1960, the Master Plan for Higher Education in California (Master Plan) is essentially an agreement between the State and the three public systems of higher education. The Master Plan serves as a framework to differentiate the mission of each system and to provide all Californians with the opportunity to access higher education. The Master Plan states that UC should draw from the top one‑eighth of the high school graduating class and CSU from the top one‑third. Community colleges must admit any high school graduate. Because of this policy—along with affordable tuition, a broad array of educational and workforce training options, and 115 colleges across the State—community colleges currently serve more students than do CSU and UC combined.
Although the Master Plan and state law require CCC, CSU, and UC to collaborate, significant separation and autonomy exists both across and within the three systems. The Master Plan recommended that one council oversee and coordinate higher education efforts, but no permanent body has served this purpose since 2011. At that time, then‑Governor Brown vetoed funding for the California Postsecondary Education Commission—essentially disbanding it—because he believed it had been ineffective. Further, the three systems are not responsible to the same authority. Unlike CCC and CSU, UC’s independence is enshrined in the State’s Constitution, and it is therefore not subject to the same level of legislative control.
Within each system, statewide governance is the product of at least three bodies: a governing board, a faculty senate, and a central administrative office. The text box describes the responsibilities of these bodies. CCC is especially decentralized because 72 local community college districts, each containing from one to nine colleges, are governed by locally elected boards that have significant authority to set policy within their own districts.
The Higher Education Systems’ Statewide Governance Consists of Three Bodies
CCC, CSU, and UC each have the following:
- A governing board that sets policy, establishes requirements, and provides guidance for the system.
- A faculty senate that has certain authority over curriculum and other issues of educational policy.
- A central administrative office that manages and oversees the system.
Source: Analysis of state law and system policies and websites.
The Role of Transfer
The Master Plan emphasized transfer from community colleges, which primarily provide lower‑division education, to CSU and UC, which provide both lower‑ and upper‑division education.1 In fact, to ensure adequate capacity and lower the costs to educate each student, the Master Plan envisioned increasingly shifting students away from CSU and UC and into community colleges for their lower‑division education. When the Master Plan was published in 1960, about 55 percent of the State’s undergraduate students within the three systems of public higher education were enrolled in community colleges, 26 percent in CSU, and 19 percent in UC. By 2023 the proportion of undergraduate students enrolled in community colleges had risen to about 75 percent, with the remaining 16 percent attending CSU and 9 percent attending UC.
The Master Plan’s vision for expanding the role of community colleges requires that CSU and UC reserve enough space to receive transfer students from community colleges. When the Master Plan was published, the ratio of CSU’s and UC’s lower‑division students to upper‑division students was about even. The Master Plan recommended that this ratio shift so that 40 percent of CSU’s and UC’s undergraduate populations were lower‑division students and 60 percent were upper‑division students—essentially reserving additional upper‑division space for incoming transfer students. In 1991 the Legislature established this same ratio in state law, as the text box shows. That legislation contained several other key statements of intent to guide the implementation of the transfer system. For example, the legislation states that the transfer system should ensure the successful transfer of students to CSU or UC, including to the campus and major of their choice, if the students’ academic performance is satisfactory. It also states that CSU and UC should prioritize the admission and enrollment of CCC students who have met transfer requirements above those students entering at the freshman or sophomore levels.
State Law Requires CSU and UC to Reserve Space for Transfer Students
“Both UC and CSU shall have as a basic enrollment policy the maintenance of upper division enrollment, which are students who have attained upper division status, at 60 percent of total undergraduate enrollment. This goal shall be met through programs aimed at increasing the numbers of qualified transfer students from the community colleges without denying eligible freshmen applicants.” [Emphasis added]
“The governing board of each segment shall ensure that individual university and college campus enrollment plans include adequate upper division places for community college transfer students in all undergraduate colleges or schools, and that each undergraduate college or school on each campus participates in developing articulation and transfer agreement programs with community colleges. The governing boards shall meet this goal within their respective general statewide planning framework used to attain and maintain the state’s goal of a 60/40 ratio of upper to lower division students, their segmental enrollment planning processes, and campus planning regarding program balance, educational quality, and other relevant goals.” [Emphasis added]
Source: Education Code section 66730.
Both the statute we quote in the text box and the related Master Plan recommendation envision the 60 percent upper‑division metric as a goal for ensuring that adequate numbers of community college transfer students can enroll at CSU and UC. However, the goal relates more directly to students’ upper‑division status than it does to their transfer status. For that reason, UC has adopted a related goal that is more specific to transfer student enrollment: its goal is to enroll two incoming resident freshmen students for every one incoming resident transfer student, which it refers to as the two‑to‑one ratio. In other words, if one assumes that it takes four years to earn a bachelor’s degree, the 60 percent upper‑division metric in state law generally equates to the enrollment of two freshmen for every one transfer student—or roughly one‑third of new students would enter as transfers. We refer to this one‑third ratio throughout our report as the transfer representation goal.2
The community college transfer process can create educational opportunities for a more diverse array of California’s students. Many sources show that students of certain racial groups and socioeconomic backgrounds are underrepresented among California’s college graduates. For instance, although the percentage of Californians with bachelor’s degrees has increased for all racial groups since 2010, disparities persist for Black or African American and Hispanic or Latino students. The transfer process can play a crucial role in addressing such disparities because students from underrepresented racial and ethnic groups have historically been more likely to start their higher education journey at a community college than at CSU or UC.
Community colleges may offer increased access to higher education for first‑generation college students and college students from low‑income households. In addition to having lower tuition costs than CSU or UC, community colleges have significantly more campuses statewide. Thus, students may not need to relocate to enroll in community college, reducing their housing and relocation costs. Community colleges may also allow students to have a more flexible class schedule if they need to work or care for family members.
Efforts to Improve the Transfer Process
The Legislature and the three public higher education systems have undertaken efforts in recent years to improve the community college transfer process, including by setting key goals for improvement. Figure 2 depicts five overarching goals that we analyze in Chapter 1. State law and the three systems have also established many other requirements and goals, some of which we discuss in Chapter 2 and Chapter 3.
Figure 2
We Evaluated Key Goals Related to Transfer
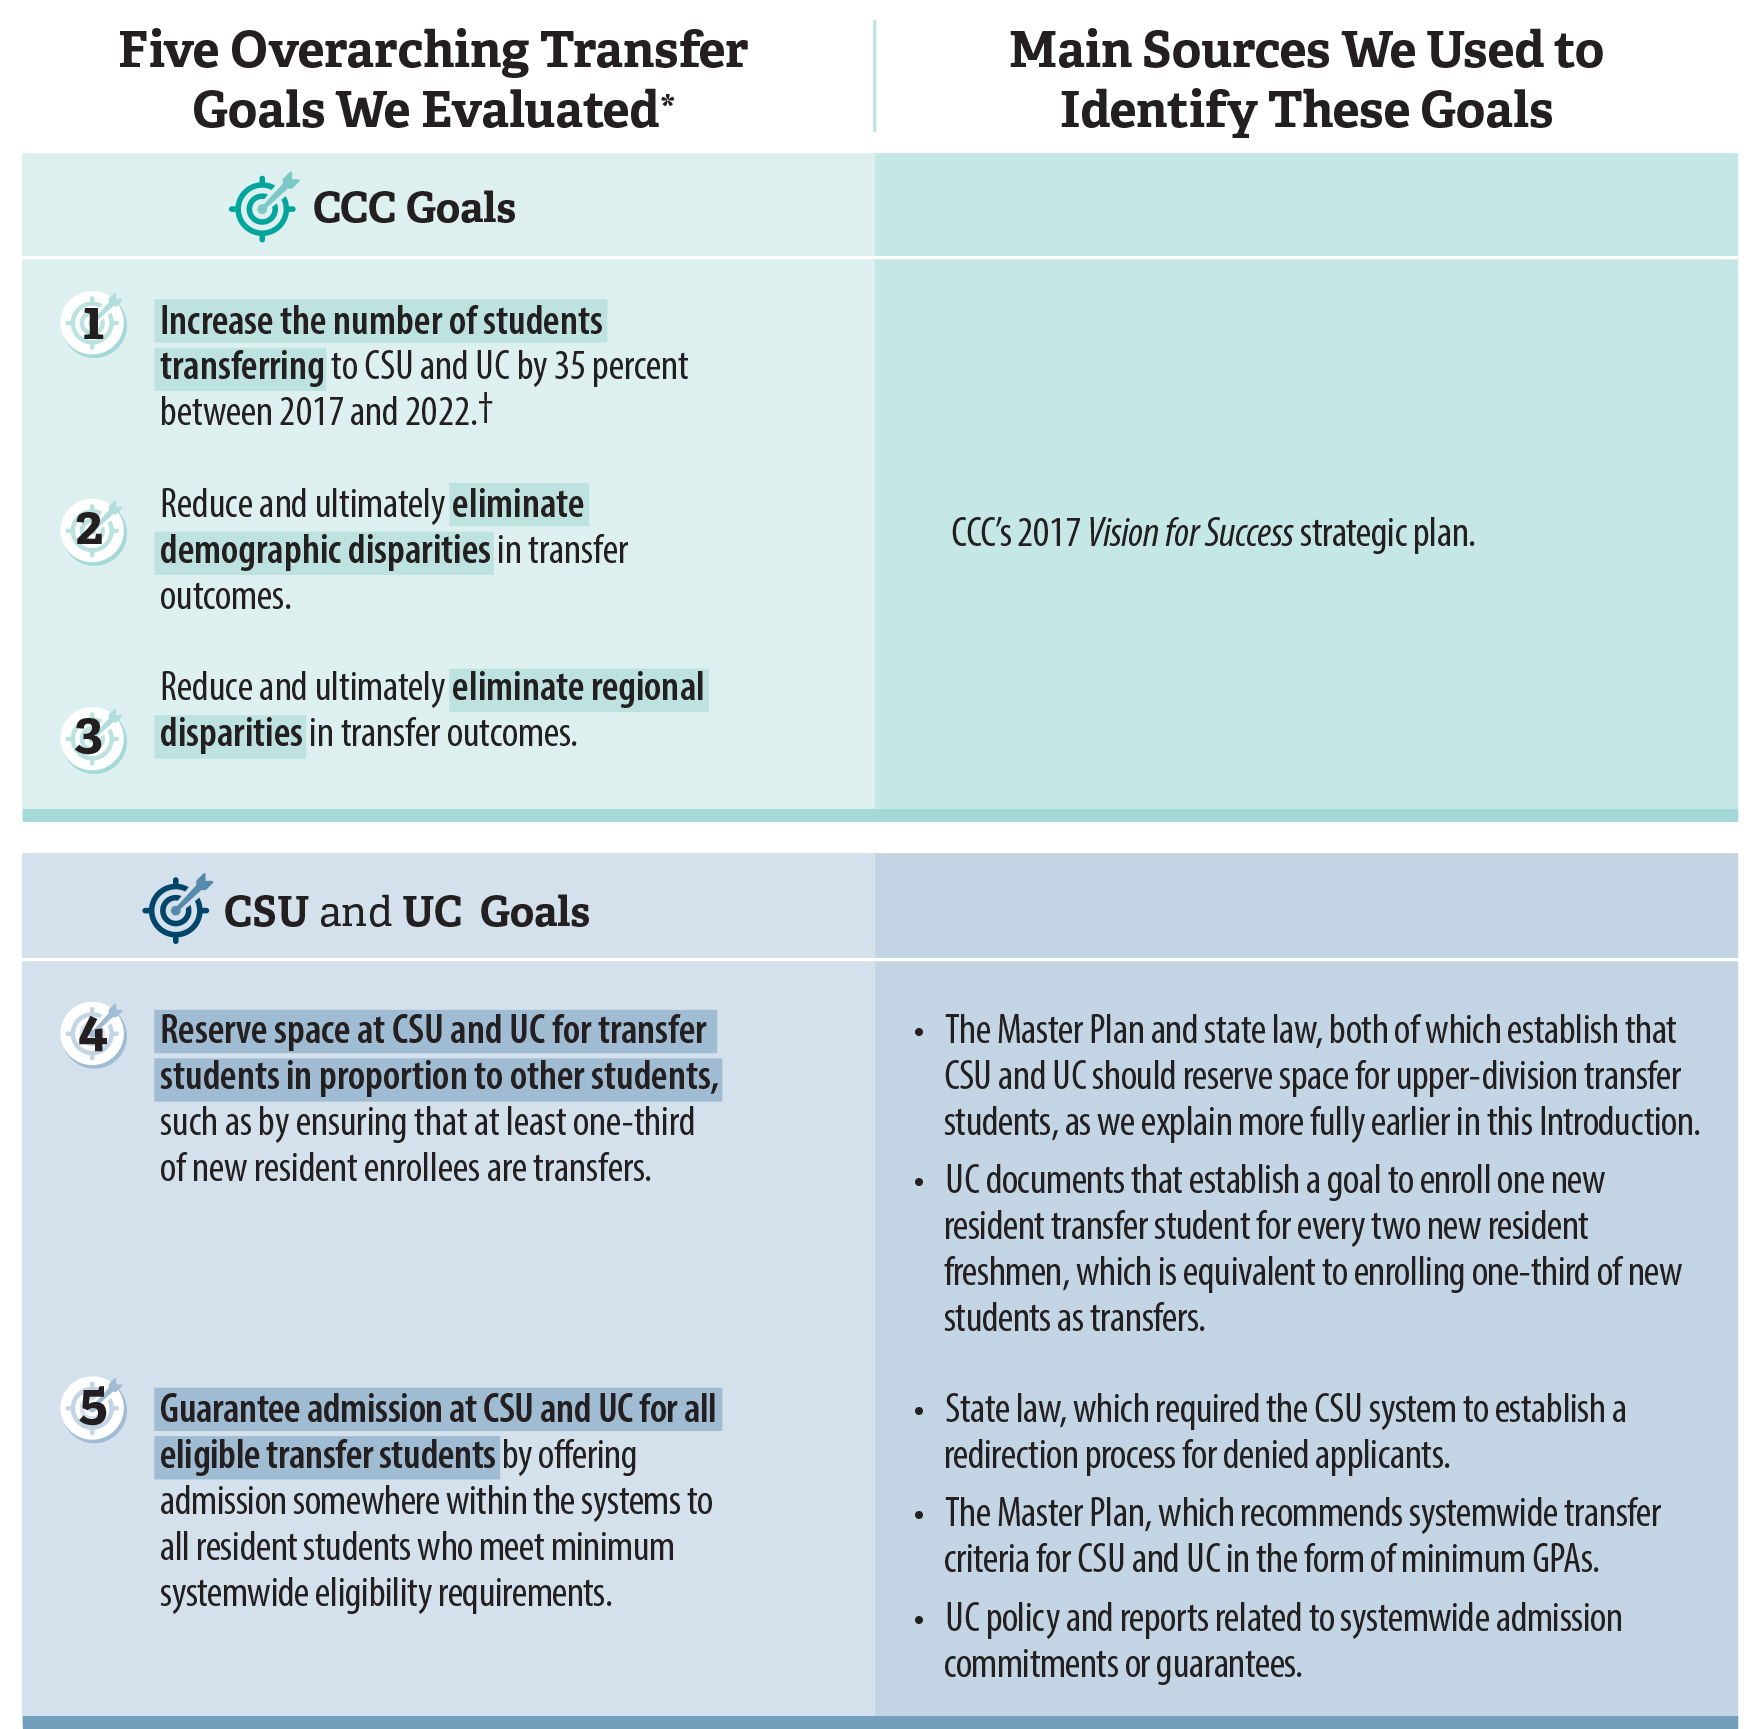
Source: Analysis of state law, the Master Plan, key documents from the three systems, and related criteria.
* We selected these five goals so we could assess the transfer system as a whole during our audit period, even though the systems have each established additional relevant goals. Further, each system did not adopt each of these goals. For example, CCC set a goal to increase the number of transfers by 35 percent, but CSU and UC did not formally agree to this goal.
† Although CCC had not established a specific goal during our audit period related to students’ rate of successful transfer, we also evaluated transfer rates, as we explain in Chapter 1.
Figure 2 is table that lists the five overarching goals related to transfer that we evaluated. The table has two columns: the first lists the goals we evaluated, and the second provides the sources we used to identify those goals. The first three goals relate to California Community Colleges and originate from the system’s 2017 Vision for Success strategic plan. The first goal is to increase the number of students transferring to the CSU and UC systems by 35 percent over five years, and the second and third goals are to reduce and ultimately eliminate demographic disparities and regional disparities in transfer outcomes. The fourth and fifth goals, which relate to the CSU and UC systems, are to reserve space at these systems for transfer students in proportion to other students, and to guarantee admission at CSU and UC for all eligible transfer students. The main sources we used to identify these CSU and UC goals include the Master Plan, state law, and UC documents.
One of the most significant changes to the transfer process in the last two decades was the introduction of the Associate Degree for Transfer (ADT), which Senate Bill 1440 (Chapter 428, Statutes of 2010) established in 2010 and Senate Bill 440 (Chapter 720, Statutes of 2013) bolstered in 2013. Figure 3 describes the ADT, which consists of a maximum of 60 semester units of general education and major preparation requirements that prepare students to enter CSU at the upper‑division level. In addition, Assembly Bill 928 (Chapter 566, Statutes of 2021) established an intersegmental committee whose responsibilities include ensuring that the ADT becomes the primary transfer pathway between the CCC system and campuses in the CSU and UC systems. Assembly Bill 1291 (Chapter 683, Statutes of 2023), signed into law in 2023, establishes a pilot program that will expand the ADT to campuses and majors within the UC system, beginning in academic year 2026–27 with the University of California, Los Angeles (UCLA). UC has also introduced other options to attempt to streamline the transfer process, such as the Transfer Admission Guarantee (TAG) and UC Transfer Pathways. We discuss these two options and the ADT in more detail in Chapter 2.
Figure 3
Community College Students Have Multiple Options to Meet CSU and UC Transfer Requirements
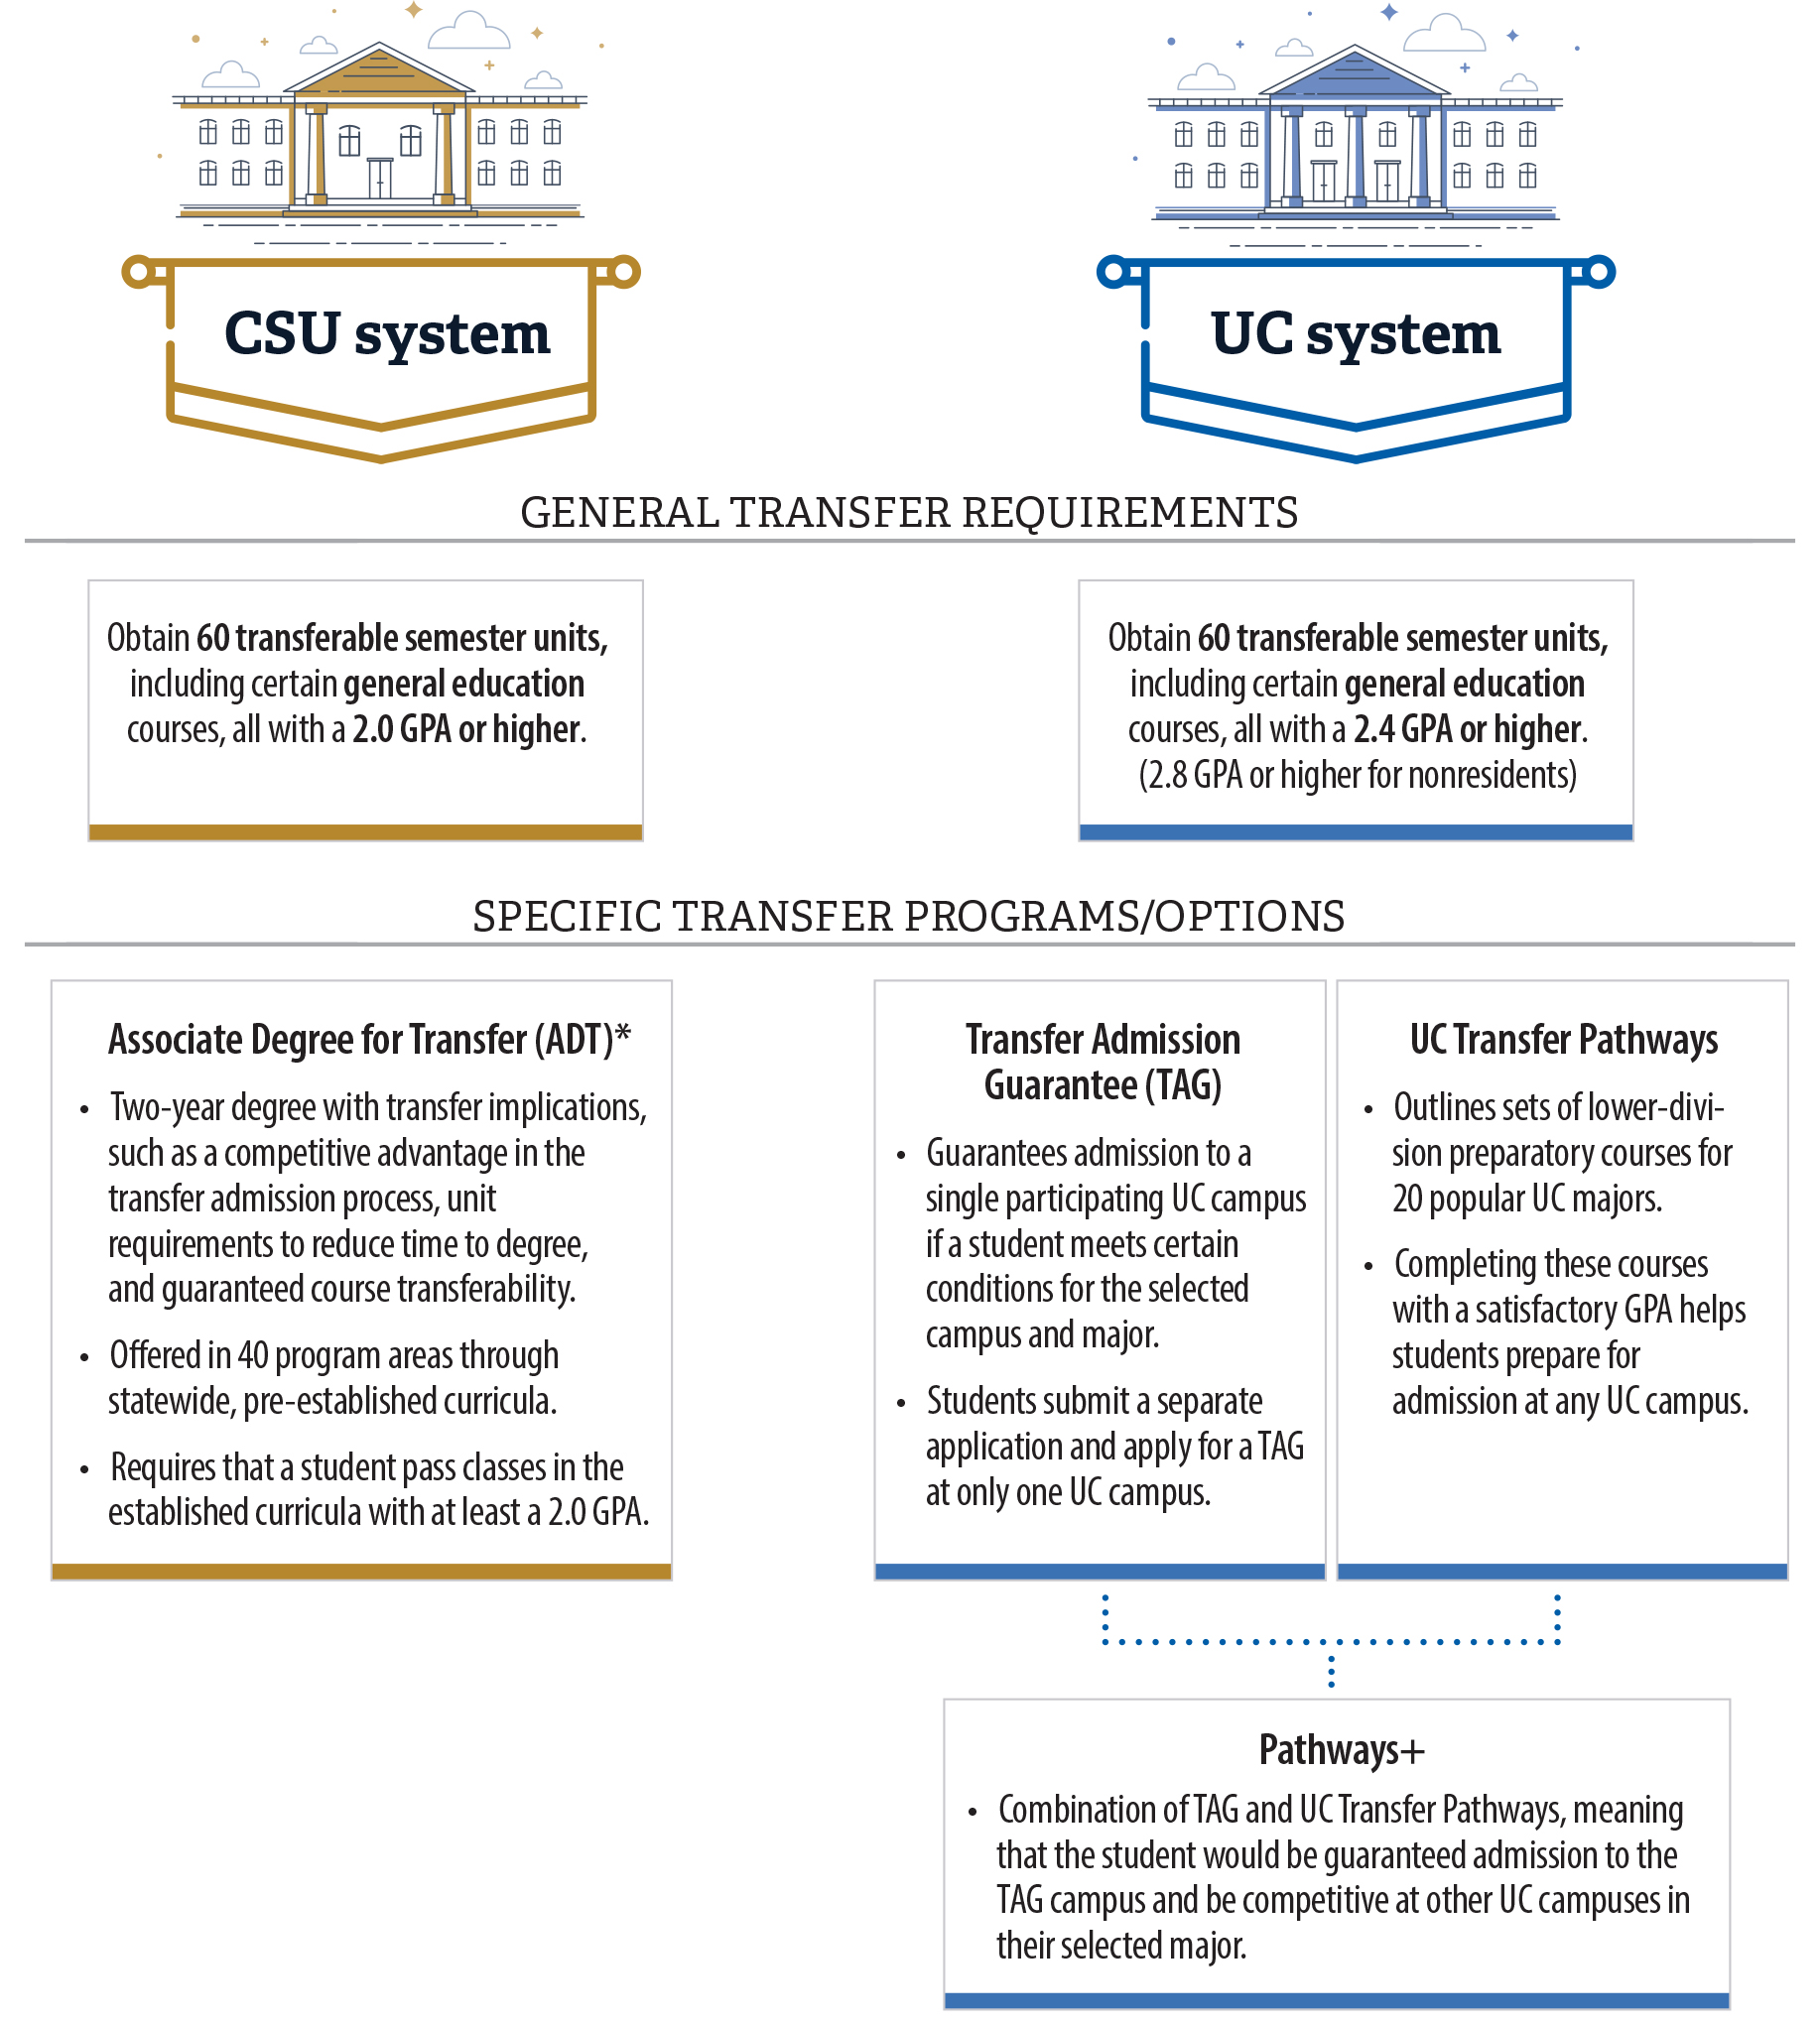
Source: Analysis of state law, CSU and UC systemwide requirements and transfer programs, and public reports.
Note: We do not include in this graphic the CSU or UC dual admission programs that we discuss in Chapter 3, because those programs are still relatively new.
* State law establishes a pilot program to expand the ADT to some campuses and majors within the UC system, beginning with at least eight majors at UCLA in the 2026–27 academic year.
Figure 3 provides an overview of transfer requirements and transfer options for the CSU and UC systems. Both systems generally require that a transfer applicant obtain 60 transferable semester units, including certain general education courses, and CSU requires a 2.0 GPA or higher for transfer whereas UC requires a 2.4 GPA or higher. In terms of specific transfer programs or options, the primary transfer program for the CSU system is the Associate Degree for Transfer, or ADT. For the UC system, there are two main transfer options: the Transfer Admission Guarantee, known as TAG, and the UC Transfer Pathways. UC considers a program called “Pathways-plus” to be a third option, and it is a combination of TAG and UC Transfer Pathways. The figure provides additional details for each of these specific programs or options, such as that the ADT is a two-year degree that can reduce transfer students’ time to earn a bachelor’s degree and guarantee course transferability.
Several other recent laws have also affected the transfer process. For example, legislation enacted in 2017 and 2022 established a framework to increase the probability that community college students will enter and complete transfer‑level coursework in English and mathematics during their first year. Legislation enacted in 2021 required CCC to adopt a common course‑numbering system across all of its colleges and, in February 2024, a task force issued its final report about the design and implementation of this effort. Another 2021 state law assigned a committee to establish a singular lower‑division general education pathway known as the California General Education Transfer Curriculum (Cal‑GETC) and separately mandated that transfer‑intending students be placed onto an ADT pathway if such a pathway exists for their intended major. Because this law is recent, its impact has not yet been fully realized. For example, Cal‑GETC will not take effect until the 2025–26 academic year.
In June 2023, the Joint Legislative Audit Committee directed our office to review the higher education systems’ efforts to improve the percentage of community college students who transfer to CSU and UC. To conduct our review, we judgmentally selected campuses to represent all three higher education systems and the State’s diverse geography and student demographics. Those campuses were the following: Clovis Community College (Clovis); Diablo Valley College (Diablo Valley); Lassen Community College (Lassen); Santa Ana College (Santa Ana); Victor Valley College (Victor Valley); San Diego State University (San Diego State); California State University, Stanislaus (Stanislaus State); University of California, Berkeley (UC Berkeley); and University of California, Santa Barbara (UC Santa Barbara).
Chapter 1
The State’s Three Higher Education Systems Have Struggled to Meet Some Key Goals Related to Student Transfers
Chapter Summary
- Only about 21 percent of community college students who began college from 2017 to 2019 and intended to transfer did so within four years, and transfer rates were even lower for students from certain demographic groups and regions of the State. Of the 745,000 transfer‑intending students who did not transfer within four years, about 96 percent did not apply to CSU or UC. Further, most of those students who did not apply—61 percent—had earned 30 or fewer units.
- More than 90 percent of CSU transfer applicants and more than 75 percent of UC transfer applicants gained admission to at least one campus in those systems. However, transfer applicants’ access to competitive campuses and majors—such as California Polytechnic State University, San Luis Obispo (Cal Poly San Luis Obispo); UC Berkeley; and science, technology, engineering, and mathematics (STEM) majors across several campuses—was more limited than their access to other campuses and majors.
- Systemwide, both CSU and UC met the key transfer representation goal of enrolling at least one‑third of their new students through transfer. However, certain campuses and majors within each of the systems did not meet this goal. CSU and UC could help ensure that transfer students have adequate access to their preferred campuses and majors by monitoring campuses’ and majors’ efforts to enroll transfer students and following up with those campuses that have low transfer representation and may be denying qualified transfer applicants.
CCC Has Taken Steps to Facilitate Student Transfers to CSU and UC, but the System Is Not Yet Meeting Certain Critical Goals
Many students enroll in community college intending to transfer, yet the percentage who successfully do so has remained low—our analysis shows that about 21 percent of transfer‑intending students transferred within four years of enrolling in a community college, and less than 30 percent transferred within six years. The possible causes for low transfer rates include underlying barriers such as financial insecurity, family responsibilities, and an inability to relocate. However, students may also face educational barriers related to accessing community college courses they need to transfer or understanding complex transfer requirements. Although CCC has taken steps to facilitate transfer and address some of these barriers, opportunities still exist for CCC to monitor and increase transfer rates.
The Number of Students Transferring to CSU and UC Has Increased but Still Falls Short of CCC’s Goal
In its 2017 Vision for Success strategic plan, CCC adopted a goal to increase the number of its students who transfer each year to CSU or UC by 35 percent over five years—from about 80,000 students to about 108,000 students. Figure 4 shows that CCC was making progress toward that goal before the effects of the COVID‑19 pandemic (pandemic) began in 2020. At that time, the number of CCC students who transferred to CSU or UC started to decline.
Figure 4
CCC Was Making Progress Toward Its Transfer Goal, but the Number of Transfers Sharply Declined After the Pandemic
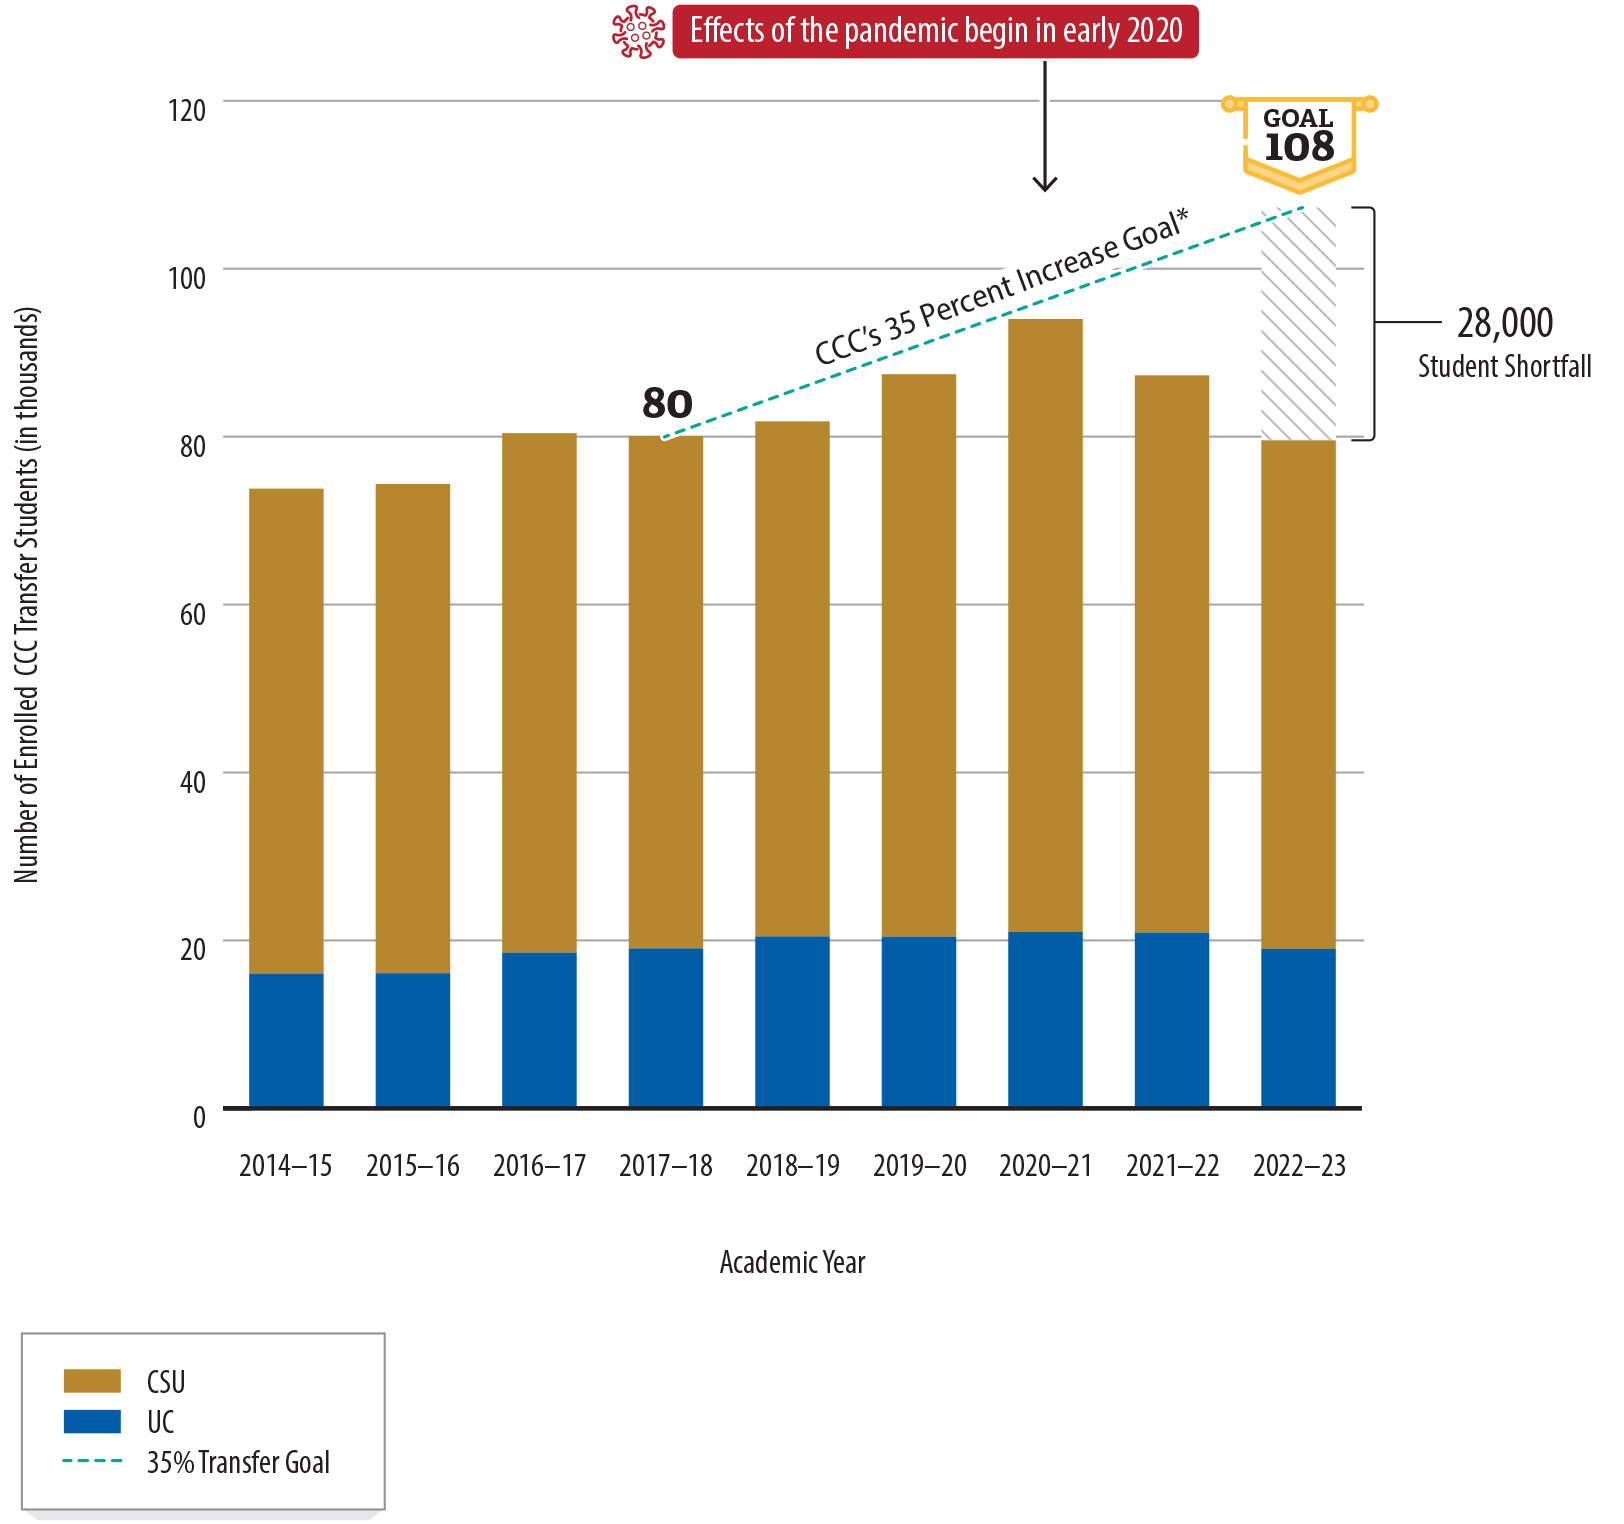
Source: CSU and UC internal application and enrollment data from 2018 through 2023, CSU and UC publicly reported enrollment data from 2014 through 2018, and CCC’s 2017 Vision for Success.
* Although CCC’s Vision for Success does not clearly articulate a baseline for this goal, we display the initial baseline for CCC’s goal to increase transfers by 35 percent as 80,000 transfers based on publicly reported CSU and UC data for academic year 2017–18.
Figure 4 is a vertical stacked bar chart showing that CCC was making progress toward its goal to increase the number of transfers to CSU and UC by 35 percent over five years—or from about 80,000 transfers to about 108,000 transfers by the 2022-23 academic year. However, the number of students transferring to CSU or UC declined after the effects of the pandemic began in early 2020. Each vertical bar represents the combined number of enrolled CCC students at CSU or UC, with different colors for transfers to CSU and transfers to UC. The horizontal axis represents academic years, starting with 2014-15 and ending with 2022-23. Academic year 2017-18 includes the baseline figure of 80,000 transfer students. That number steadily increased through the 2020-21 academic year, but declined after that, resulting in a 28,000-student shortfall from CCC’s goal of 108,000 transfers by academic year 2022-23.
Beyond the overall number of students who transfer to CSU and UC, another measure of the effectiveness of the community college transfer process is the rate of successful transfer among all CCC students who express a goal of transferring or who exhibit course‑taking behavior consistent with the intent to transfer (transfer‑intending students). When transfer rates are low, it means that fewer CCC students successfully obtain bachelor’s degrees and benefit from the associated opportunities, such as increased earnings. Despite the importance of measuring transfer rates, the CCC system had not established a formal goal for this metric at the time of our audit. However, the CCC Chancellor’s Office has published on its website these types of transfer rates statewide and for individual community colleges. It and other research entities have found that only a fraction of community college students who intend to transfer are able to do so successfully.
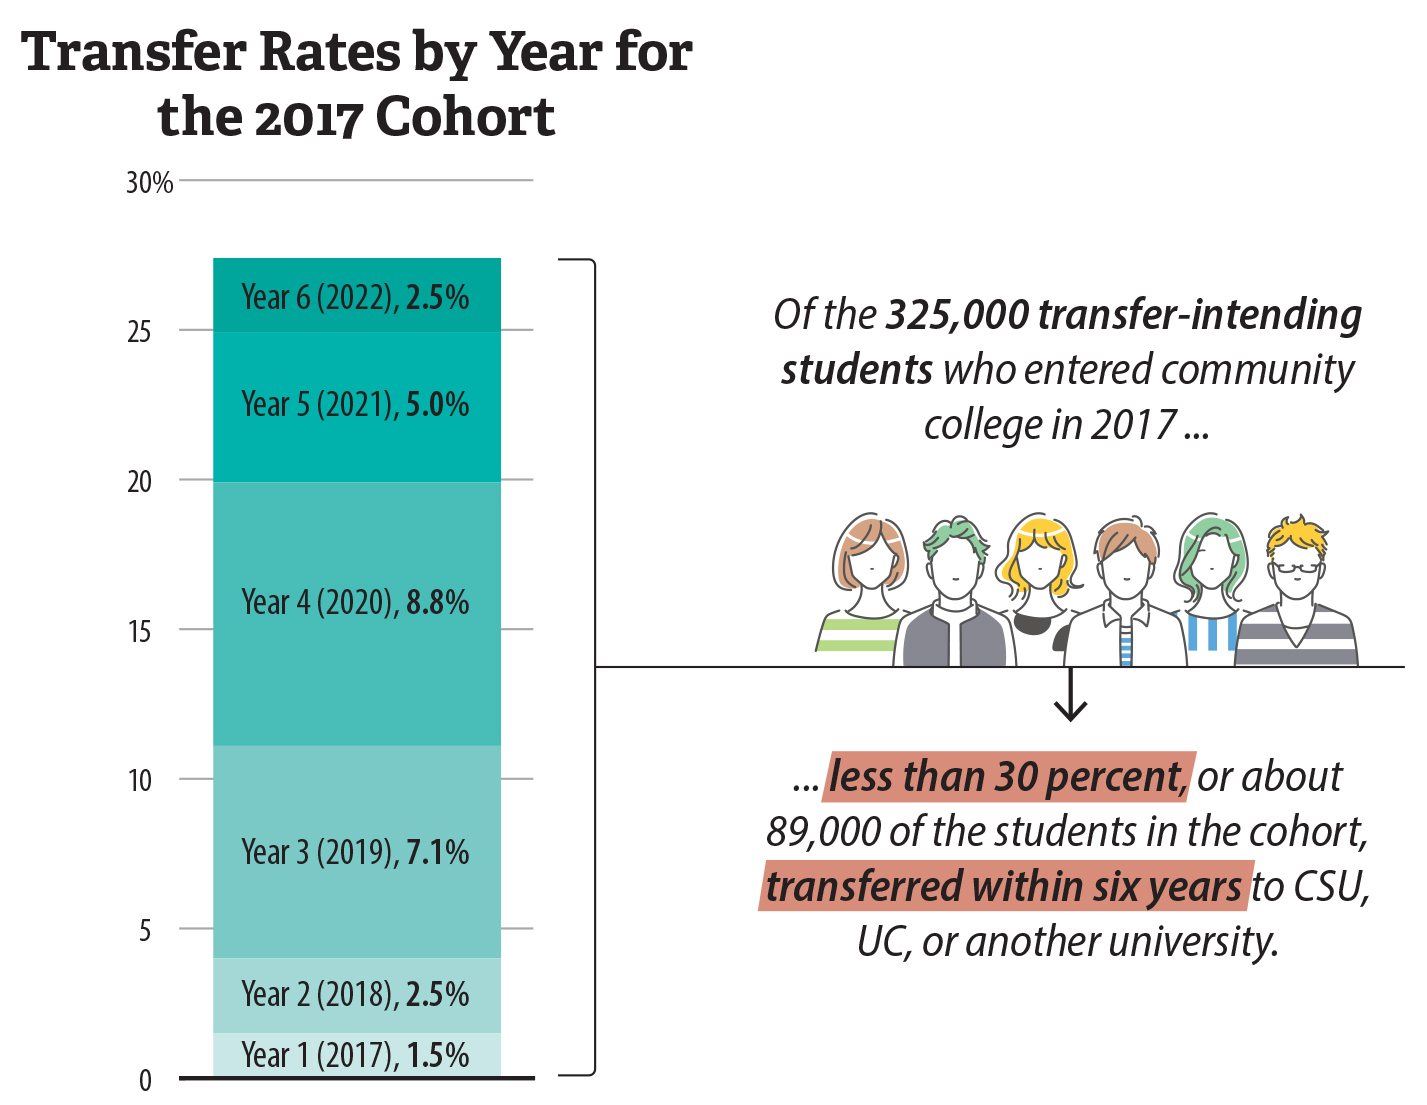
When we analyzed data from the State’s three higher education systems, we found that less than 30 percent of the 325,000 transfer‑intending students who enrolled in community college in 2017 transferred within six years, as Figure 5 shows. To calculate this transfer rate, we identified the cohort of students who entered community college in 2017. We then limited this cohort to transfer‑intending students and measured how many transferred within the six years. In addition to the six‑year cohort transfer rate for students who entered community college in 2017, we also calculated transfer rates for four‑year cohorts—displayed in Table A.1 of Appendix A—to provide comparisons across time and to include students who entered college more recently.
Figure 5
Most Transfer‑Intending Students Did Not Transfer Within Six Years
Source: CCC student and course data and CSU and UC admissions data.
Note: The transfer rates above are based on our matches of CCC students to CSU and UC admissions data and National Student Clearinghouse data provided by the CCC Chancellor’s Office. A small number of CCC students may have transferred to CSU, UC, or other universities whom we were unable to identify because of limitations in the data. For more information, refer to the Scope and Methodology section in Appendix D.
Figure 5 is a graphic showing transfer rates by year for the 2017 cohort of transfer-intending community college students. The graphic includes a single vertical bar in which transfer rates are stacked by year for each of the six years beginning with 2017. For example, 8.8 percent of cohort students transferred in Year 4, which was 2020—the most common of the six years for students to have transferred. The figure explains that of the 325,000 transfer-intending students who entered community college in 2017, less than 30 percent, or about 89,000 of the students in the cohort, transferred within six years to CSU, UC, or another university.
The four‑year transfer rates we calculated remained relatively consistent—about 20 percent across several different student cohorts, as Table A.1 in Appendix A shows. For example, the transfer rate increased by less than 1 percent from the 2017 cohort to the 2019 cohort, although the total number of transfer‑intending students in the cohorts declined by about 6 percent during the same period. The transfer rates we calculated also generally align with other entities’ findings, even though their methodologies may have differed. For instance, the Public Policy Institute of California published a report in August 2023 that stated that about 19 percent of transfer‑intending students transfer within four years of their initial community college enrollment.
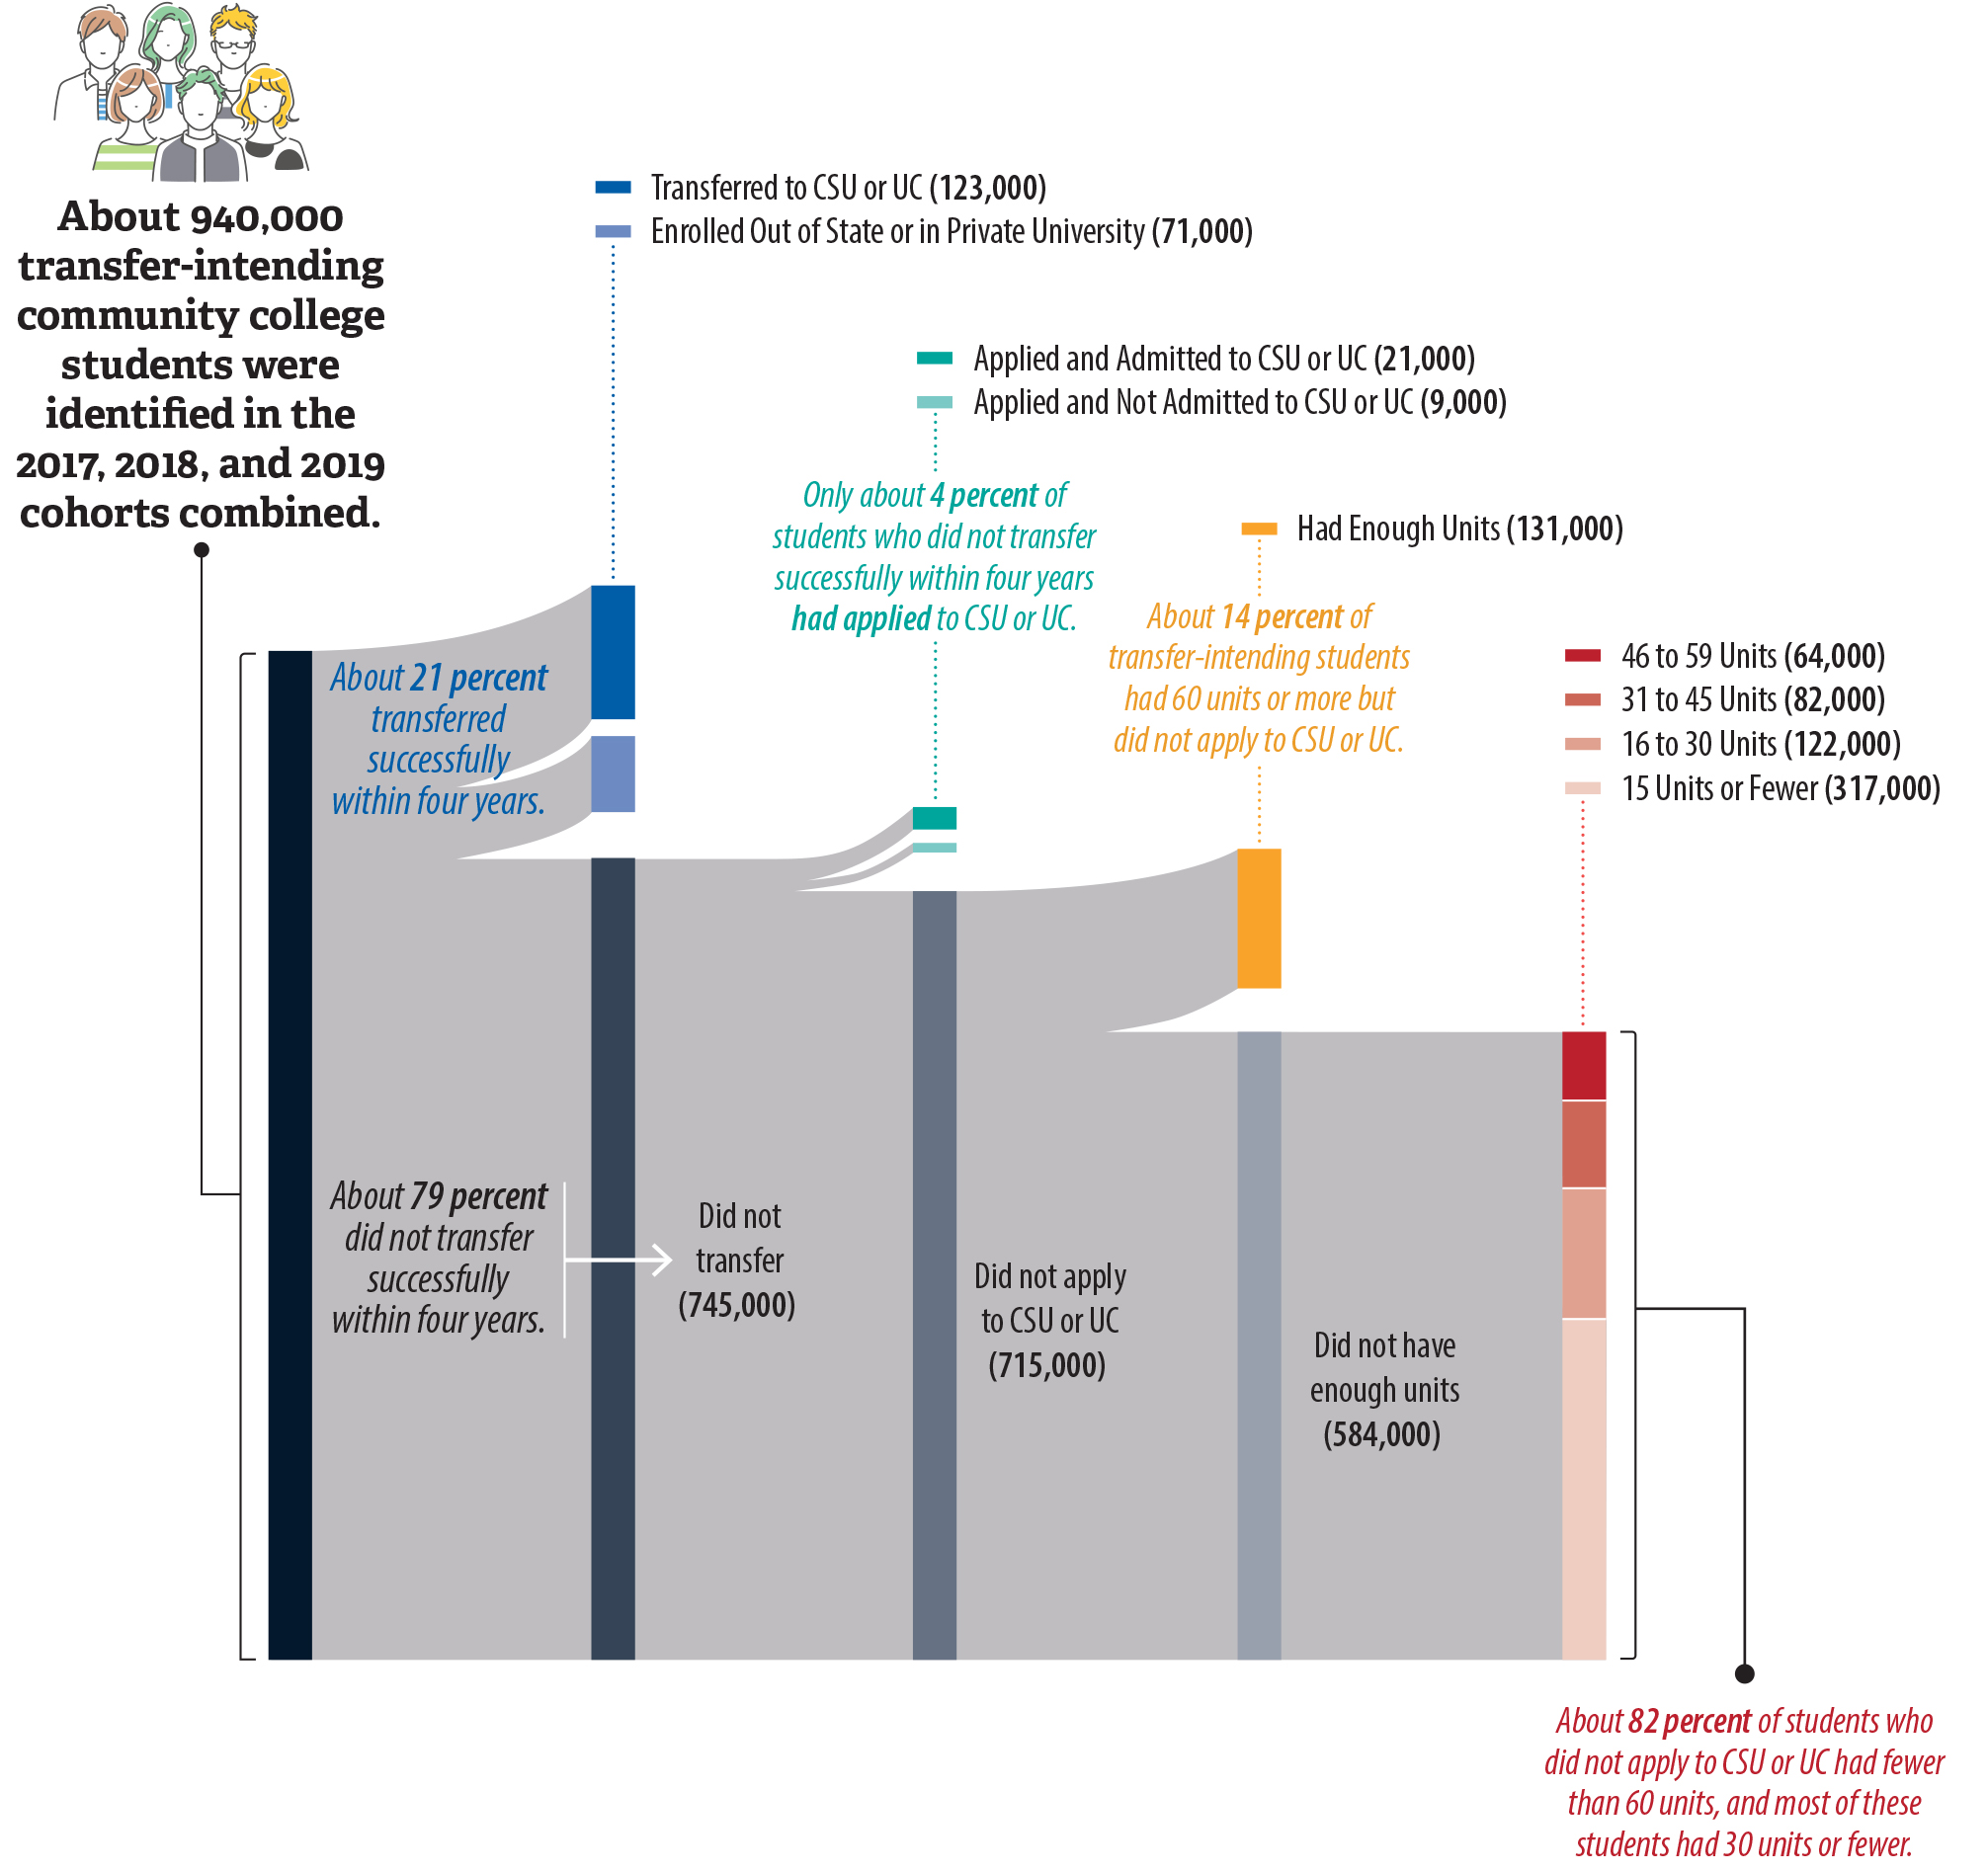
Most transfer‑intending students who did not successfully transfer within four years never applied to CSU or UC, likely in large part because they had not earned enough units of credit. Figure 6 depicts the transfer outcomes for students in all three of the four‑year cohorts that we analyzed, and it illustrates that most transfer‑intending students who did not apply to CSU or UC earned fewer than 60 units of community college credit. In fact, slightly more than half of those students earned 15 units or fewer. Many causes could explain this trend, including students not completing courses or not returning after the first term.3
Figure 6
Most Students Who Did Not Transfer Within Four Years of Enrollment Had Not Applied to CSU or UC, and Many Had Earned Few Units
Source: Analysis of CCC, CSU, and UC data, including National Student Clearinghouse information for students who transferred to universities other than CSU and UC.
Notes: Individual numbers are rounded and may not align precisely with the totals presented.
The transfer rates above are based on our matches of CCC students to CSU and UC admissions data and National Student Clearinghouse data provided by the CCC Chancellor’s Office. A small number of CCC students may have transferred to CSU, UC, or other universities whom we were unable to identify because of limitations in the data. For more information, refer to the Scope and Methodology section in Appendix D.
The National Student Clearinghouse data we analyzed, which we relied upon for information about students who transferred to universities other than CSU and UC, did not include information about students’ applications for transfer. Therefore, the portion of this graphic related to applications and admissions includes information only for CSU and UC.
Figure 6 is a Sankey diagram that moves from left to right to show that most students who did not transfer within four years of enrollment had not applied to CSU or UC and had earned few units of credit. On the left, the chart begins with 940,000 transfer-intending community college students among the 2017, 2018, and 2019 cohorts combined. The diagram then shows that about 21 percent of this combined cohort transferred successfully within four years to CSU, UC, or another university, meaning that 79 percent did not transfer within four years. Of the 79 percent or 745,000 students who did not transfer, only about 4 percent had applied to CSU or UC. The final stage of the diagram depicts that of those students who did not apply to CSU or UC, the vast majority—about 82 percent or 584,000 students—had fewer than 60 units, which implies that they did not have enough units to transfer. In fact, most of these students with fewer than 60 units had 30 units or fewer.
Other students in the cohorts we analyzed did not apply to CSU or UC even though they may have been transfer‑ready. For instance, about 14 percent of transfer‑intending students—131,000 students—did not apply for transfer within four years despite earning 60 units or more of community college credit, as Figure 6 shows.4 The text box includes some of the possible reasons that these students did not apply to CSU or UC. Similarly, the Research and Planning Group for California Community Colleges (RP Group) reported in May 2020 that thousands of students had made significant progress toward transfer but found themselves stuck in the system or abandoned their goals. In addition to identifying other areas of opportunity, the RP Group recommended that community colleges begin by quantifying the transfer‑intending populations on their campuses and proactively reaching out to help students who have made considerable progress toward transfer.
Possible Reasons That Students With 60 or More Units Did Not Apply to CSU or UC
- They delayed transferring until a later time, perhaps because of the effects of the pandemic.
- Even though they had enough overall units, they had not met the course or GPA requirements for a particular CSU or UC campus or major.
- They faced other barriers, such as financial constraints, family responsibilities, or difficulty navigating the application process.
- They entered the work force having decided that they did not want to transfer.
Source: Interviews with CCC Chancellor’s Office and community college officials corroborated by public reports and research.
Other sources and best practices also identify ways in which colleges could monitor students’ progress toward transfer and provide targeted interventions, some of which we discuss in Chapter 3, to help them reach the point of applying and transferring. For example, Diablo Valley’s 2021 program review of its transfer services included a strategy to increase outreach to students enrolled in transfer‑level English and math support courses—such as through class visits to the transfer center—to reach and assist the students most at risk of not transferring. In addition, an intersegmental committee report from December 2023 recommended reengaging students who have already earned an ADT but did not apply to transfer. Nearly 16,000 students statewide across the three cohorts we measured had obtained an ADT within four years of enrollment but did not apply to CSU or UC, as we show in Table A.8 in Appendix A. A 2021 update to CCC’s Vision for Success highlighted additional examples of promising practices at specific community colleges. CCC’s assistant vice chancellor for data, visualization, and research acknowledged that some community colleges have already developed practices for increasing transfer rates and told us that determining the success of these practices would be a helpful first step that could then allow the Chancellor’s Office to provide useful guidance to all colleges.
As the text box shows, underlying low transfer rates are several fundamental barriers that transfer‑intending students face. Although some barriers we detail in the text box involve factors largely outside of the higher education systems’ control, the systems can still take important steps to facilitate and simplify the transfer process, as we discuss throughout this report.
Students May Face Several Barriers to Successfully Transferring
Key institutional barriers that are primarily a CCC responsibility:
- Lack of timely and accurate information about the transfer process.
- Difficulty for students to access and successfully complete courses needed for transfer.
Key institutional barriers that are primarily a CSU and UC responsibility:
- Complex transfer requirements that are difficult for students to understand and fulfill.
- Limited capacity to accommodate students at some campuses and majors.
Key personal barriers that require support from the three systems:
- Inability to address basic needs, such as financial security or family responsibilities, making it difficult to prioritize the effort to transfer.
- Inability to relocate or access universities outside of the local community.
Source: Analysis of public research and reports, and interviews with CCC Chancellor’s Office and community college officials.
Students in Some Demographic Groups Are Significantly More Likely to Transfer Than Students in Others
State law and CCC have established that the system should make efforts to help students from historically underrepresented groups transfer. For example, state law includes requirements for CCC to work toward the goal of eliminating disparities in outcomes between certain demographic groups (achievement gaps), including those related to transfer, as a condition of receipt of certain state funds. Similarly, CCC established a 10‑year goal in its 2017 Vision for Success to reduce and ultimately close achievement gaps across a range of outcomes, such as transferring successfully.
Although some transfer‑related achievement gaps have narrowed in recent years, significant disparities still exist. For example, the four‑year transfer rate for Hispanic or Latino students in the 2019 cohort was about 15 percent, compared to the rate of nearly 21 percent for all students. Table A.5 in Appendix A provides additional details on transfer outcomes by demographic group for the student cohorts we analyzed. In general, the disparities between the overall makeup of our cohorts and the students who ultimately transferred are wider at UC than at CSU, especially for Black or African American and Hispanic or Latino students. Public data and research show that in recent years, both systems have increased their shares of community college transfer enrollees who are from certain underrepresented groups, particularly Hispanic or Latino students. Nevertheless, the remaining gaps mean that transfer‑intending students from some demographic groups are less likely to achieve their transfer goals.
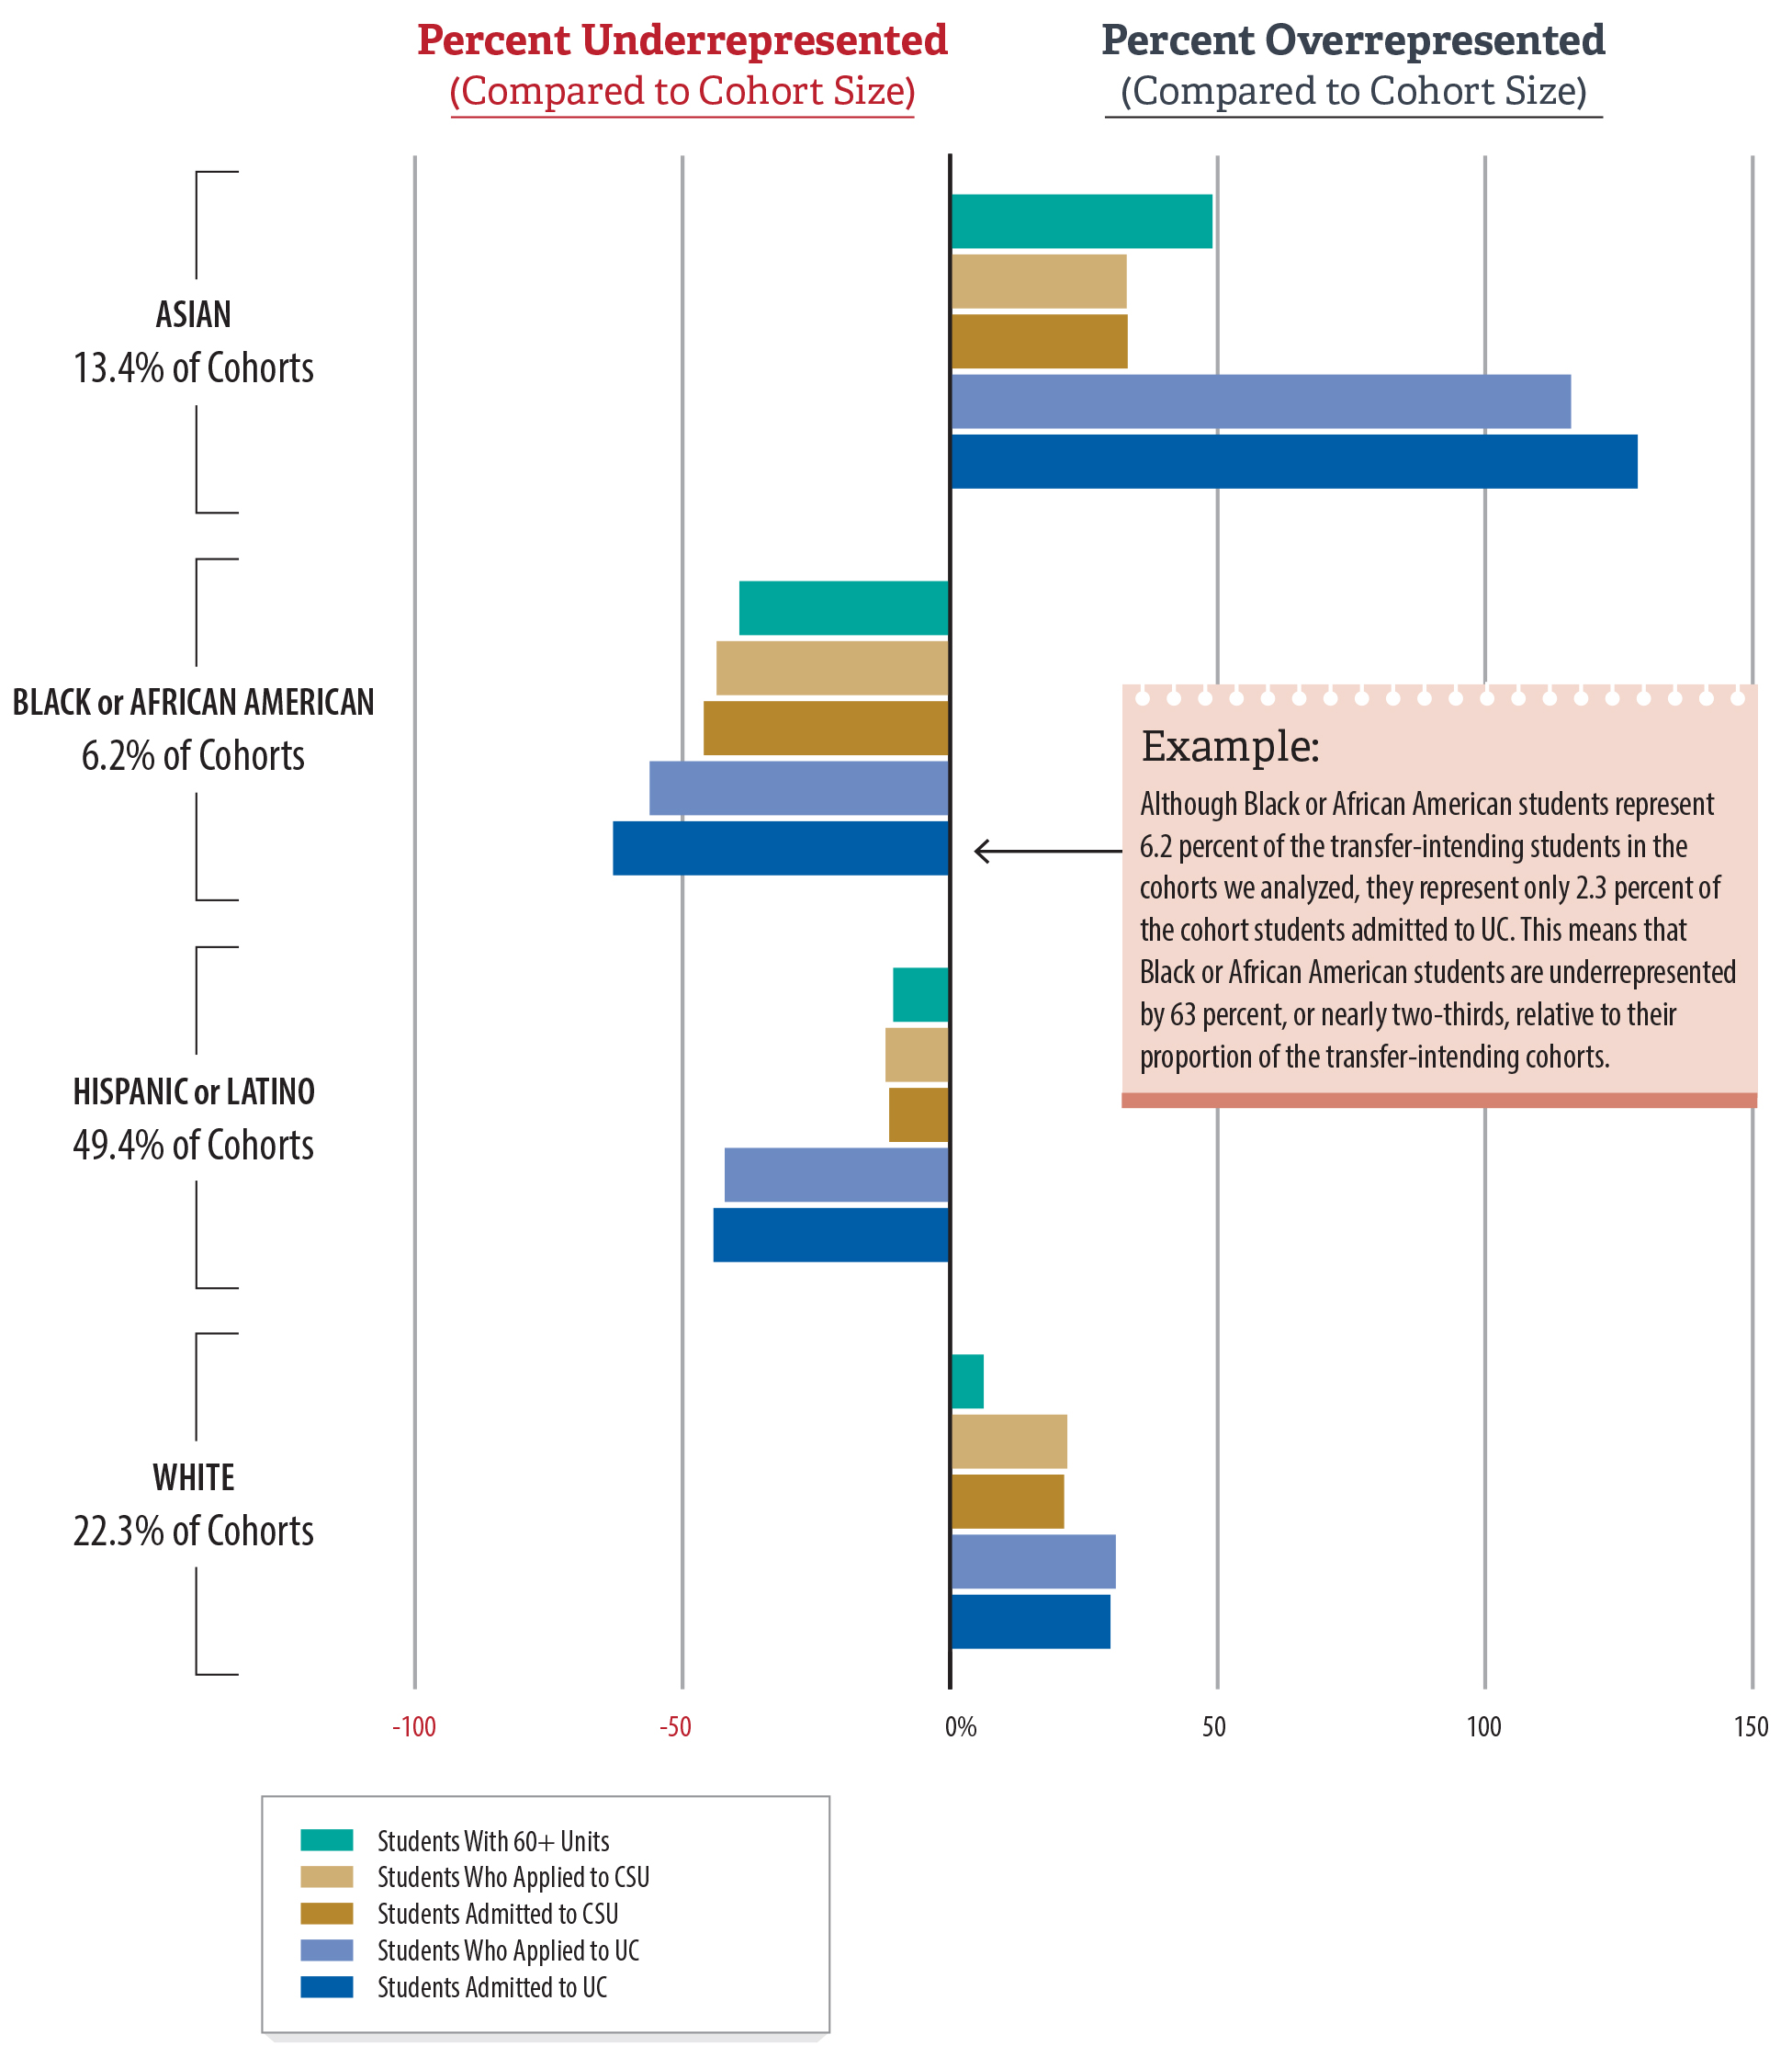
Understanding the stages of the transfer process that contribute to demographic disparities can reveal their possible causes and inform more targeted interventions. We found that racial or ethnic groups’ representation changed at several stages in the transfer process for the 2017 through 2019 cohorts, including at or before the transfer application stage, as Figure 7 shows. For example, Hispanic or Latino students comprise less of the population who applied to UC, which is a large part of why they also make up less of the population who were admitted to UC. Similarly, Black or African American students comprise about 6 percent of transfer‑intending students in the cohorts but only about 3 percent of cohort applicants to CSU and UC. In Chapter 3, we discuss approaches each system could take to better identify and support transfer‑intending community college students, including students from underrepresented groups.
Figure 7
Not All Student Groups Are Represented Equally in Transfer Preparedness and Admissions
Source: Analysis of a combination of the 2017, 2018, and 2019 student cohorts we created based on CCC, CSU, and UC data.
Notes: The outcomes above—such as whether students obtained 60 or more units, applied to transfer, and were admitted—are based on four years of data beginning with the year a student entered into the community college system. We depict only the four largest racial or ethnic groups in the cohorts.
The application and admission rates above are based on our matches of CCC students to CSU and UC admissions data. A small number of CCC students may have applied or been admitted to CSU or UC whom we were unable to identify because of limitations in the data. For more information, refer to the Scope and Methodology section in Appendix D.
Figure 7 is a clustered horizontal bar chart depicting the four largest racial or ethnic student groups’ representation at different stages of the transfer process for the combined 2017, 2018, and 2019 transfer-intending cohorts. For each group—Asian students, Black or African American students, Hispanic or Latino students, and white students—five bars signify the group’s representation among students at different stages of the transfer process. These stages consist of students with 60 or more units, students who applied to CSU, students who were admitted by CSU, students who applied to UC, and students who were admitted by UC. For each group, bars to the left of the central axis represent an underrepresentation compared to the cohort of transfer-intending students, and bars to the right represent an overrepresentation of the group. In general, the chart shows that Asian and white students were overrepresented in these five transfer stages compared to their share of the initial cohort, whereas Black or African American and Hispanic or Latino students were underrepresented. The chart also reveals that racial or ethnic groups’ representation changed at different stages, including at or before the transfer application stage.
Some Community Colleges and Regions Have Significantly Lower Transfer Rates Than Others
As an example of how transfer rates vary among community colleges, for the 2017 through 2019 cohorts we reviewed, the 10 colleges with the highest four‑year transfer rates averaged rates of about 33 percent, whereas the 10 colleges with the lowest rates averaged about 10 percent. Table A.2 in Appendix A shows transfer rates for those colleges with the highest and lowest rates and for the five colleges we selected for this audit. Transfer rates also varied by community college district, many of which contain only one college. The differences in transfer rates mean that transfer‑intending students at certain community colleges are significantly more likely to transfer than those at other colleges.
Location is one cause of college‑level differences in transfer rates. As Table A.6 in Appendix A shows, our review found that community colleges in the Bay Area, San Diego, and South Central regions had higher transfer rates than colleges located in the Central Valley, Inland Empire, and Northern regions of the State. One factor contributing to this difference may be the distances between community colleges and CSU and UC campuses in those regions. Students are more likely to transfer to a nearby university for a variety of reasons, including challenges associated with relocating.
The executive vice president of student and administrative services at Lassen—a college in rural Northern California—stated that proximity is a major barrier for its students who want to transfer to CSU or UC. The nearest CSU or UC campus to Lassen is Chico State University, which is more than a two‑hour drive. In fact, in the cohorts we analyzed, nearly 76 percent of the Lassen students who successfully transferred did so to an out‑of‑state institution. A number of these students may have transferred to the University of Nevada, Reno, because it is closer to Lassen than any CSU or UC campus.
Similarly, Victor Valley’s dean of student services stated that location is a significant barrier to transfer for the college’s students. For example, its transfer‑intending students face a difficult commute through a mountain pass to reach the nearest CSU and UC campuses in San Bernardino and Riverside, and the public transportation options are limited. The dean added that the cost of living in those areas is much higher than in Victor Valley’s service area, which is a burden for most students.
Research has proposed solutions for geographic barriers to transfer. For example, the Public Policy Institute of California suggested in its August 2023 report that community colleges located far from universities should work to establish partnerships that allow students to obtain a bachelor’s degree by taking university courses at the community college. Lassen’s executive vice president of student and administrative services stated that the college has been working to develop such partnerships with CSU campuses and that the partnerships are helpful for students. However, she stated that challenges persist, such as persuading CSU faculty to relocate to establish programs at Lassen or convincing CSU campuses of the viability of alternative options that incorporate hybrid learning models. Similarly, San Diego State has an Imperial Valley branch that serves students in southeastern California who may not be able to relocate to San Diego, which is more than 100 miles away from the branch.
State law allows community college districts to establish bachelor’s degree programs as long as certain conditions are met, including that the bachelor’s degrees do not duplicate degrees that CSU and UC already offer. Expanding the ability of geographically isolated community colleges to offer bachelor’s degrees could help those colleges’ students meet their educational goals. The Public Policy Institute of California has also found that uneven outreach from four‑year institutions, especially in regions with fewer campuses, may constrain students’ awareness of potential transfer destinations, making them less likely to apply. It stated that four‑year institutions must do more to reach out to students, an approach we discuss more fully in Chapter 3.
In addition to location, other factors may contribute to differences in community colleges’ transfer rates. As we show in Figure 7, student groups are not all represented equally in terms of transfer preparedness and admissions—and community colleges serve different proportions of these student groups. Similarly, some colleges—such as Diablo Valley or Irvine Valley College—may attract students who have demonstrated strong academic performance and who wish to transfer to a nearby campus, such as UC Berkeley or the University of California, Irvine. Finally, as we discuss in Chapter 3, we identified weaknesses in some colleges’ processes for helping students transfer.
CSU Admits Nearly All Transfer Applicants but Not Always to Their Preferred Campuses and Majors
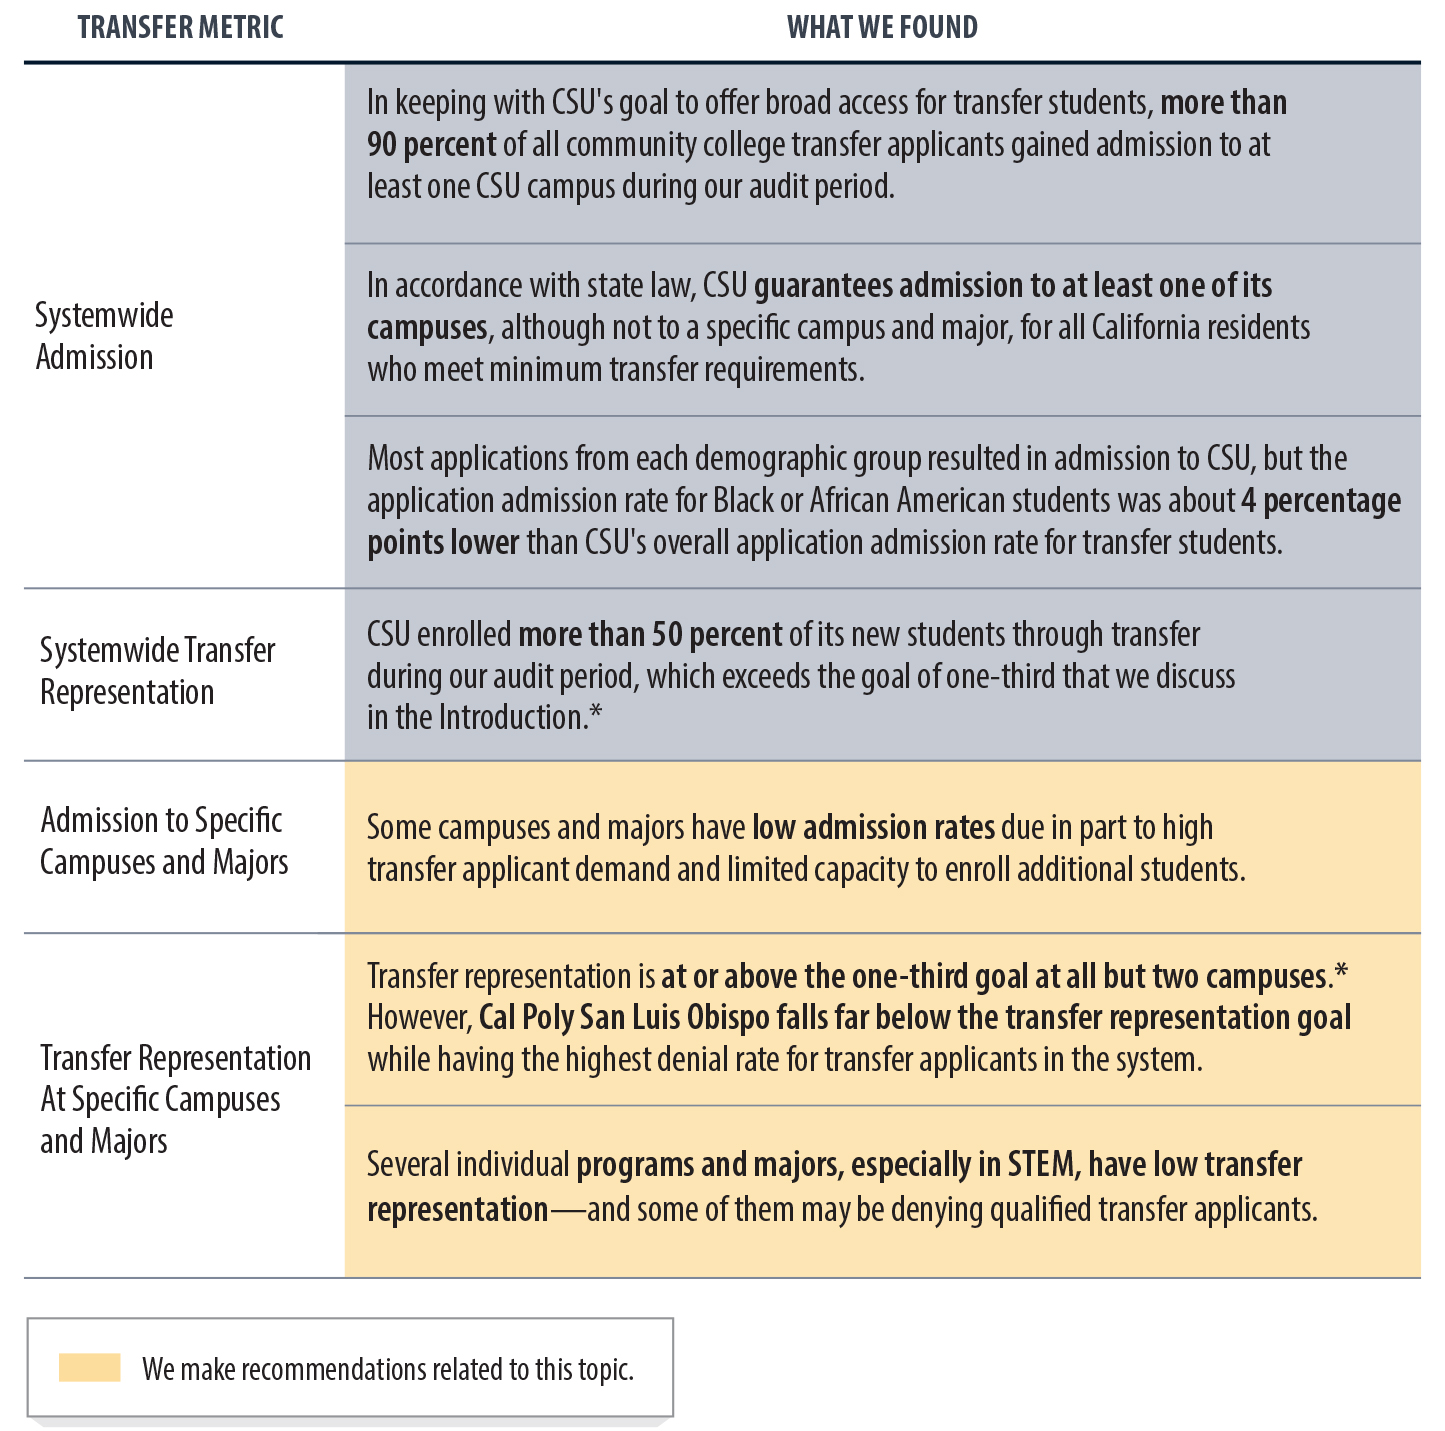
As Figure 8 demonstrates, most community college transfer students who apply to CSU gain admission to at least one campus. However, they do not necessarily gain admission to their preferred campus or major. Students may prefer a particular campus or major for a variety of reasons, including the potential future employment opportunities associated with earning a degree. They must also meet requirements specific to those campuses or majors, as we discuss in Chapter 2. By prioritizing the admission of transfer students to certain competitive campuses and majors, CSU could better ensure that these students ultimately enroll and earn degrees in their desired fields of study.
Figure 8
CSU Accommodates Many Transfer Students but Can Improve Access to Certain Campuses and Majors
Source: Analysis of state law, the Master Plan, CSU application and enrollment data, and other system documents.
* As we explain in the Introduction, we derived this goal—to enroll one‑third of new resident undergraduates through transfer—from a UC goal that is related to an upper‑division enrollment requirement for CSU and UC in state law.
Figure 8 includes analysis of four transfer metrics that we discuss in our report as they relate to CSU—systemwide admission, systemwide transfer representation, admission to specific campuses and majors, and transfer representation at specific campuses and majors. For example, with regard to systemwide admission, we found that more than 90 percent of all community college transfer applicants gained admission to at least one CSU campus during our audit period. In terms of transfer representation, the system enrolled more than 50 percent of its new resident undergraduates through transfer. However, we found that some individual campuses and majors have low admission and transfer representation rates, with Cal Poly San Luis Obispo falling far below the transfer representation goal while having the highest denial rate for transfer applicants in the system. A key at the bottom of the graphic indicates that we make recommendations related to these findings about CSU campuses and majors.
CSU Admits More Than 90 Percent of All Community College Transfer Applicants
As we note in the Introduction, one key expectation in law is that CSU is to offer admission to all eligible transfer applicants. In alignment with this goal, CSU’s overall admission rate is high: it admitted to at least one campus more than 90 percent of the nearly 500,000 CCC students who applied to transfer from academic years 2018–19 through 2022–23. Table B.1 in Appendix B shows that this systemwide admission rate remained relatively constant during our audit period. Further, as we discuss in the next section, CSU has established a process for determining applicants’ eligibility and ensuring that all eligible students have an opportunity to enroll at one of its campuses.
CSU also largely met another key goal to enroll a sufficient number of transfer students compared to the number of freshmen students it enrolls. Although CSU has not explicitly framed that goal in terms of enrolling at least one‑third of its students through transfer, this specific ratio aligns with the intent of both the Master Plan and state law, as we discuss in the Introduction. As Figure 9 shows, CSU enrolled far more than one‑third of its incoming students through transfer. In fact, many CSU campuses enrolled transfer students at a rate greater than one‑half of all incoming students.
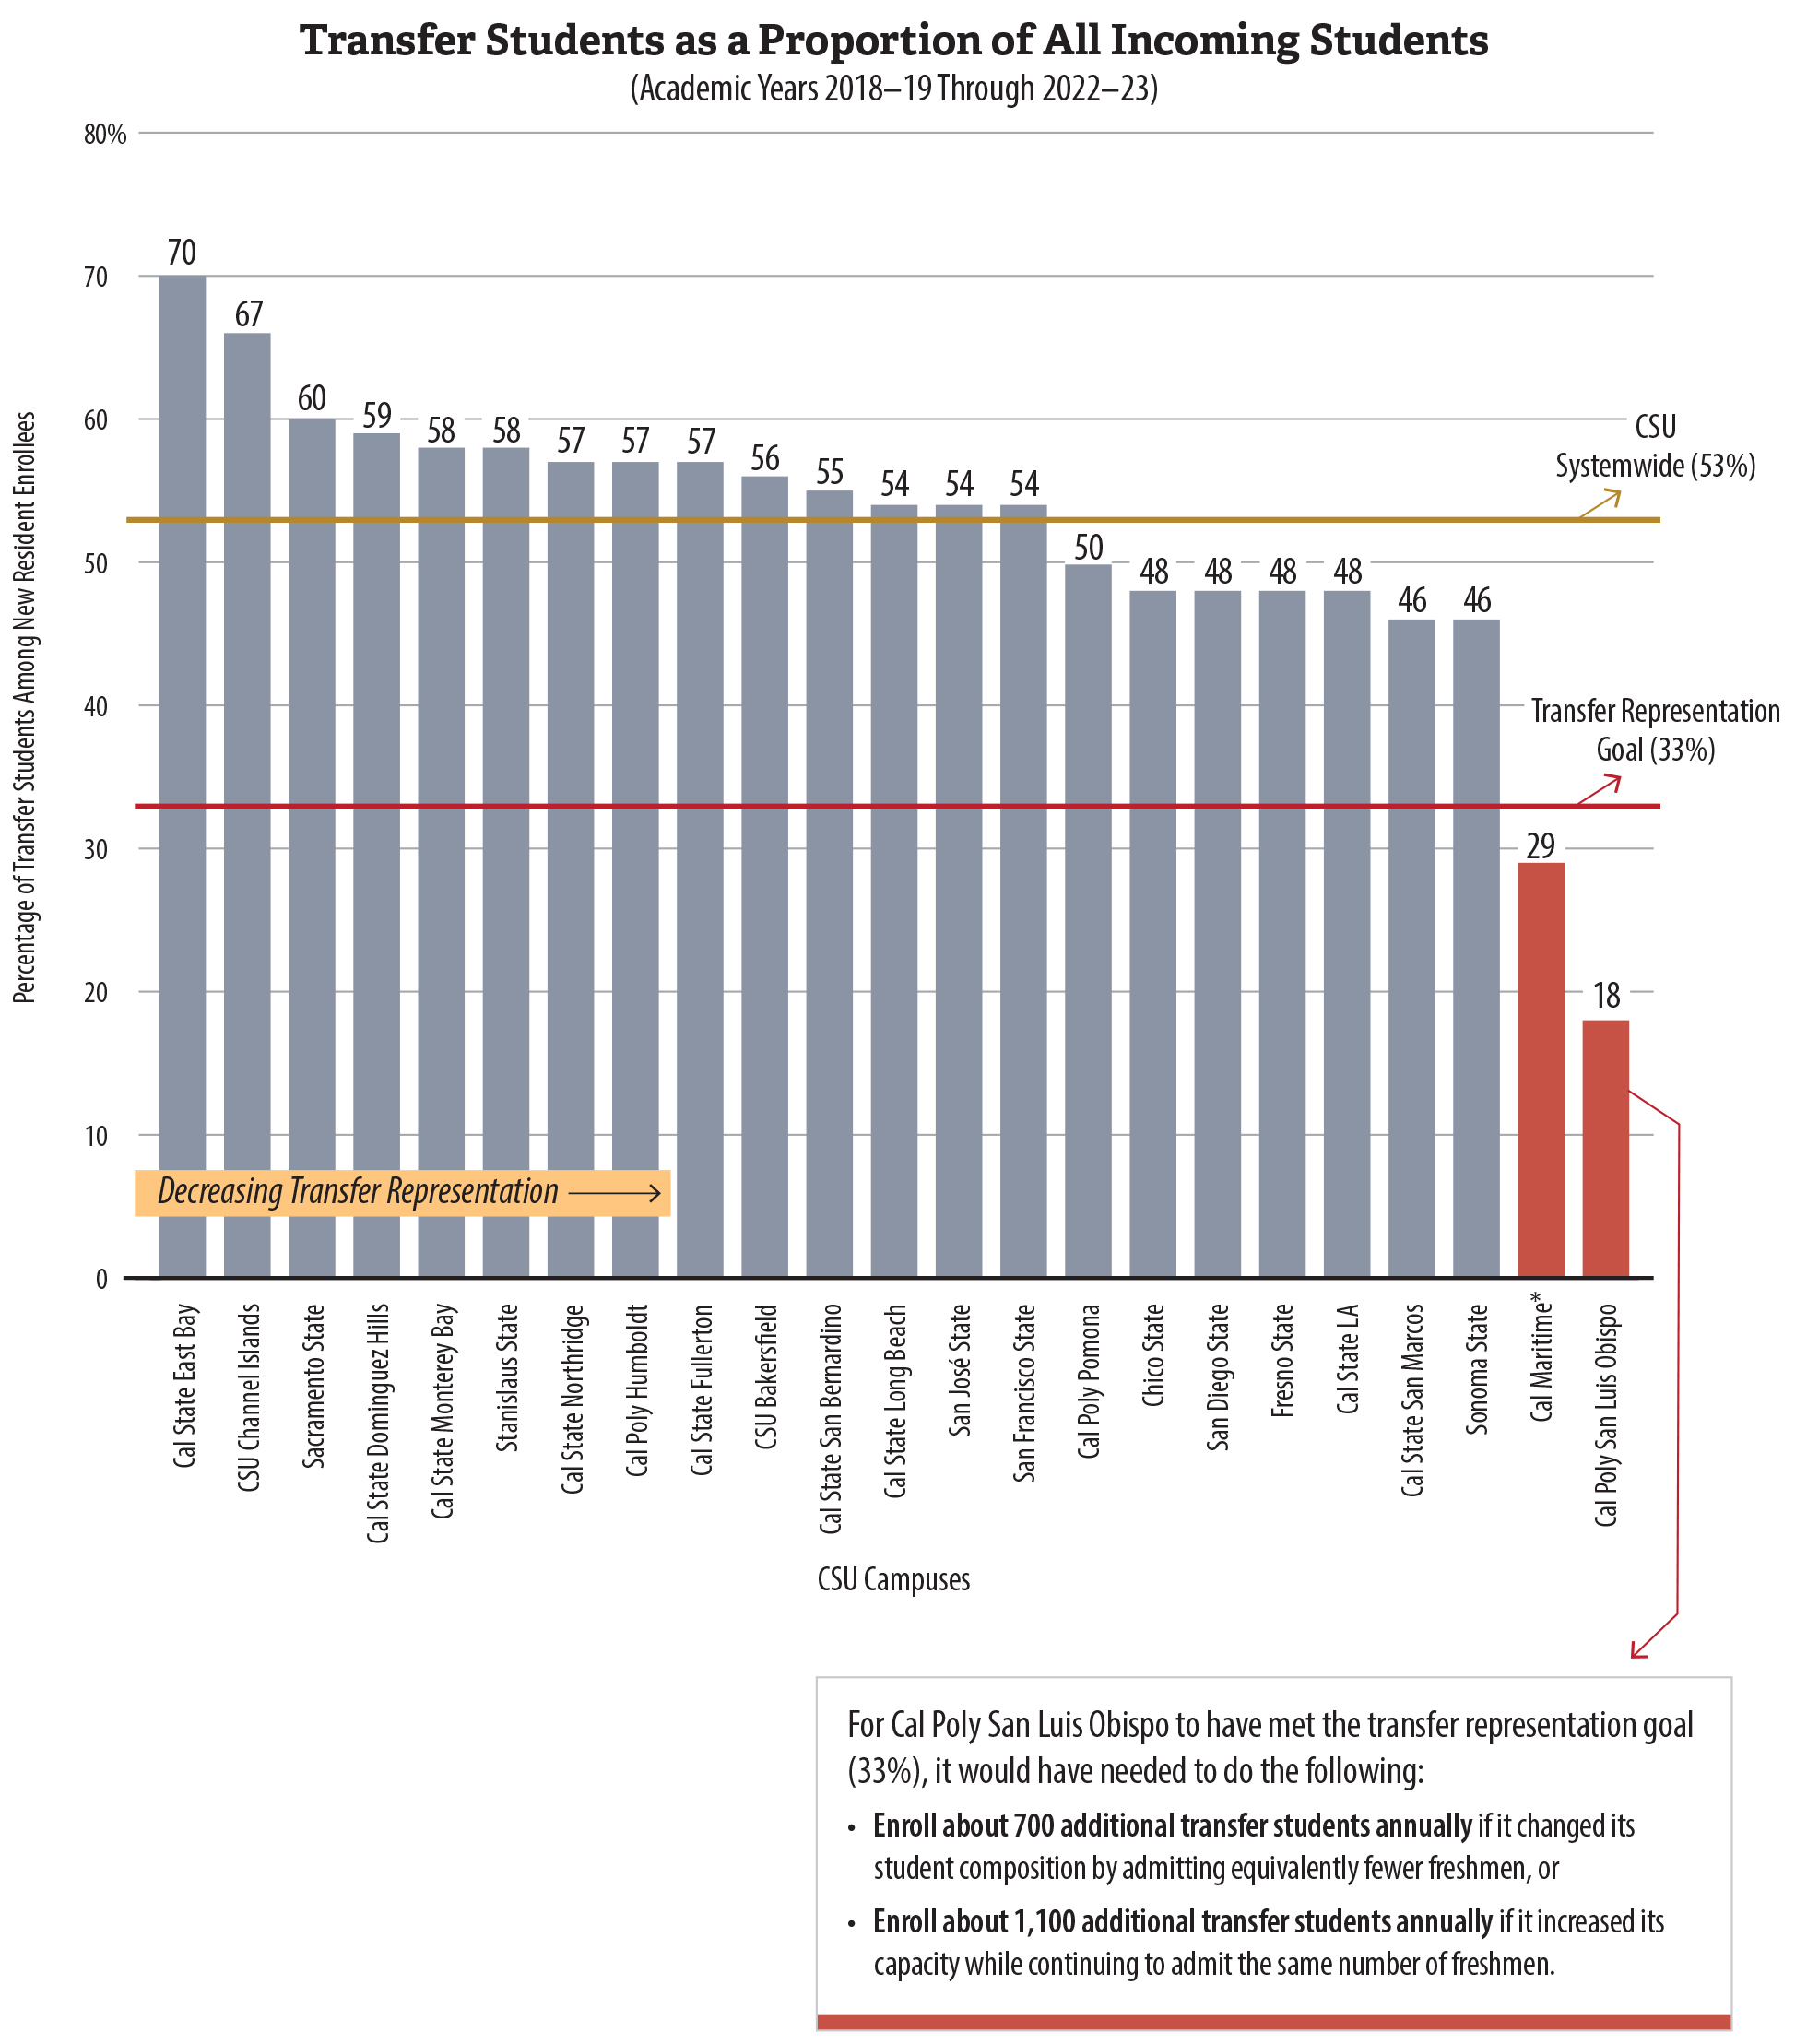
Figure 9
A Large Proportion of CSU’s New Enrollees are Transfer Students, but Cal Poly San Luis Obispo Has Low Transfer Representation
Source: Analysis of CSU enrollment data from academic years 2018–19 through 2022–23.
Note: We included in these ratios all transfer students, not just those from community colleges, and we limited the ratios to California resident students because UC has used this methodology and we wanted to provide consistency between CSU and UC ratios. However, according to CSU’s public dashboards, more than 96 percent of students who transfer to CSU are California residents, and more than 93 percent of resident students who transfer to CSU originate from California community colleges.
* Cal Maritime has limited and specialized programs compared to other CSU campuses, which may affect its level of transfer representation.
Figure 9 is a bar chart consisting of 23 bars that show each CSU campus’s percentage of transfer students among its new resident enrollees, with the campuses presented from left to right in decreasing order of transfer representation. One horizontal line shows that, systemwide, CSU’s transfer representation is about 53 percent, and another shows the transfer representation goal of about 33 percent. Cal State East Bay is the CSU campus with the largest share of transfer students among incoming resident undergraduates, at 70 percent. Thirteen other campuses have transfer representation percentages above 50 percent. Two campuses fall under the 33 percent goal: Cal Maritime is at 29 percent and Cal Poly San Luis Obispo is at 18 percent. A box below the bar chart explains that for Cal Poly San Luis Obispo to have met the 33 percent transfer representation goal, it would have needed to enroll about 700 to 1100 additional transfer students annually, depending on whether it admitted equivalently fewer freshmen or simply increased its enrollment capacity while admitting the same number of freshmen.
Although the CSU system as a whole easily met the one‑third benchmark, the campuses’ individual success in meeting this goal varied. As Figure 9 shows, all but two CSU campuses enrolled more than 45 percent of their incoming student body as transfer students. However, California State University Maritime Academy (Cal Maritime) and Cal Poly San Luis Obispo enrolled just 29 percent and 18 percent, respectively. The percentage Cal Maritime enrolled was just below the one‑third mark, which is likely because the campus offers limited and specialized courses of study and enrolls few students. In contrast, low transfer representation paired with high denial rates for transfer applicants may be a cause for concern at Cal Poly San Luis Obispo, the most competitive campus for transfer applicants of any campus in the CSU or UC systems. Certain majors at other CSU campuses present a similar concern. We discuss both of these issues in the next section.
CSU fairly consistently admits transfer applicants from each major demographic group, although its admission rate is lower for Black or African American students than for students in general. Table B.3 in Appendix B shows CSU’s admission rates by demographic group for community college transfer applicants during our audit period. Of note, CSU admitted 66 percent of Black or African American transfer applicants, which is about 4 percentage points lower than the percentage of all transfer applications it admitted. This gap generally aligns with CSU’s public dashboard, which displays unduplicated totals and shows that, on average, about 84 percent of Black or African American transfer applicants gained admission systemwide compared to 88 percent of all applicants.5 The assistant vice chancellor of institutional research and analysis at the CSU Chancellor’s Office stated that data showed Black or African American applicants were slightly more likely, relative to other groups, not to meet minimum CSU eligibility or to have incomplete or withdrawn applications. System officials are aware of this gap and stated that they have recently instituted programs to address it by easing the transfer application process, including its Black Student Success initiative, Transfer Success Pathway, and CSU Transfer Planner.
Transfer Students May Struggle to Gain Admission to Their Preferred CSU Campuses and Majors
Transfer students are more likely to enroll at CSU if they are admitted to their preferred campus and major.6 However, certain CSU campuses and certain majors at some CSU campuses do not have the capacity to accommodate all of the eligible students who apply to them. CSU generally refers to this situation as impaction and has adopted a redirection policy to avoid denying those students admission to programs at other campuses that are not impacted. The text box shows the seven impacted CSU campuses and key impacted majors at other campuses for undergraduate students in academic year 2023–24.
CSU’s Impacted Campuses and Key Impacted Majors in Academic Year 2023–24
Impacted campuses:
- Fresno State*
- Cal State Fullerton
- Cal State Long Beach
- Cal State LA
- San Diego State
- San José State
- Cal Poly San Luis Obispo
Key majors that are impacted at some non-impacted campuses:
- Biological Sciences
- Business
- Criminology/Criminal Justice
- Engineering
- Nursing
- Psychology
Source: CSU website.
* Fresno State was no longer impacted as of Fall 2024.
Impacted CSU campuses and majors generally have lower admissions rates. For example, Cal Poly San Luis Obispo and San Diego State had the lowest campus transfer admission rates—19 percent and 30 percent, respectively—from academic years 2018–19 through 2022–23, as Table B.2 in Appendix B shows. Moreover, these two campuses admitted transfer applications to their computer science majors at rates of just 8 percent and 13 percent, respectively.
When CSU does not admit eligible students to the campuses and majors to which they have applied, it instead uses a process outlined in its redirection policy to offer those students the opportunity for admission to campuses that can accommodate them in the same or similar majors.7 The text box shows the minimum eligibility requirements for upper‑division transfer students. To carry out the redirection process, CSU identifies all eligible resident applicants who did not gain admission to the CSU campuses to which they applied and allows them the opportunity to select a first‑ and second‑choice campus that is not impacted. CSU then routes these applicants to either their selected campuses, if they have enrollment capacity, or to campuses that have enrollment capacity.
CSU’s Minimum Eligibility Requirements for Upper-Division Transfer Students
Applicants must complete at least 60 semester (90 quarter) units of CSU-transferable credit and earn a 2.0 GPA in all transferable units attempted. The units must including the following:
- At least 30 semester (45 quarter) units of CSU‑transferable general education credit.
- One transferable course in written communication, oral communication, and critical thinking with a grade of C- or better.
- One transferable course in mathematics or quantitative reasoning with a grade of C- or better.
Impacted CSU campuses and majors are authorized to use supplemental admission criteria to screen applicants. For example, San Diego State generally requires applicants to complete all preparation for major courses listed in the campus’s catalog.
Source: State law, CSU 2023–24 Admission Handbook, and San Diego State’s website.
CSU redirects most transfer students from three of its most competitive campuses: Cal Poly San Luis Obispo, San Diego State, and Cal State Long Beach. According to data that CSU provided, it redirected more than 25,000 community college transfer applicants during academic years 2019–20 through 2022–23. However, during the same period, only a very small number of these transfer students actually enrolled through CSU’s redirection process—about 1,700 students, or 7 percent.
Since the Fall 2019 term, CSU has used between seven and 10 campuses for redirection because these campuses have the necessary capacity. However, during academic year 2023–24, five of the seven redirection campuses were located in Northern California, while the majority of the impacted campuses were located in Southern California. According to the results of a CSU survey of the students it redirected, the two most common reasons among respondents for not enrolling were an inability to relocate and not wanting to attend any of the available campuses. These reasons signal that transfer students are less likely to enroll at a redirection campus.
Transfer students may lack access to their preferred campuses and majors in part because Cal Poly San Luis Obispo and certain competitive majors at other campuses disproportionately consist of freshmen instead of transfers. As we describe previously, Cal Poly San Luis Obispo has the lowest transfer representation in the CSU system and enrolls significantly less than one‑third of its incoming students through transfer. Moreover, the campus enrolls less than one‑third in 17 of its 19 academic disciplines, and for the remaining two disciplines, the transfer representation among students who graduate—a metric we discuss in more detail in the next paragraph—was also less than one‑third. Other campuses similarly enroll low proportions of transfer students in some disciplines or majors, but not to the extent of Cal Poly San Luis Obispo. For example, from 2018 through 2023, transfer students represented just 21 percent and 27 percent of new resident enrollees in San Diego State’s biological science major and computer science major, respectively. However, transfer students comprised 48 percent of new resident students for the campus as a whole during that same period. In general, transfer students are less represented in STEM majors and disciplines than they are in other majors and disciplines. Figure 10 highlights some of our concerns in this area.
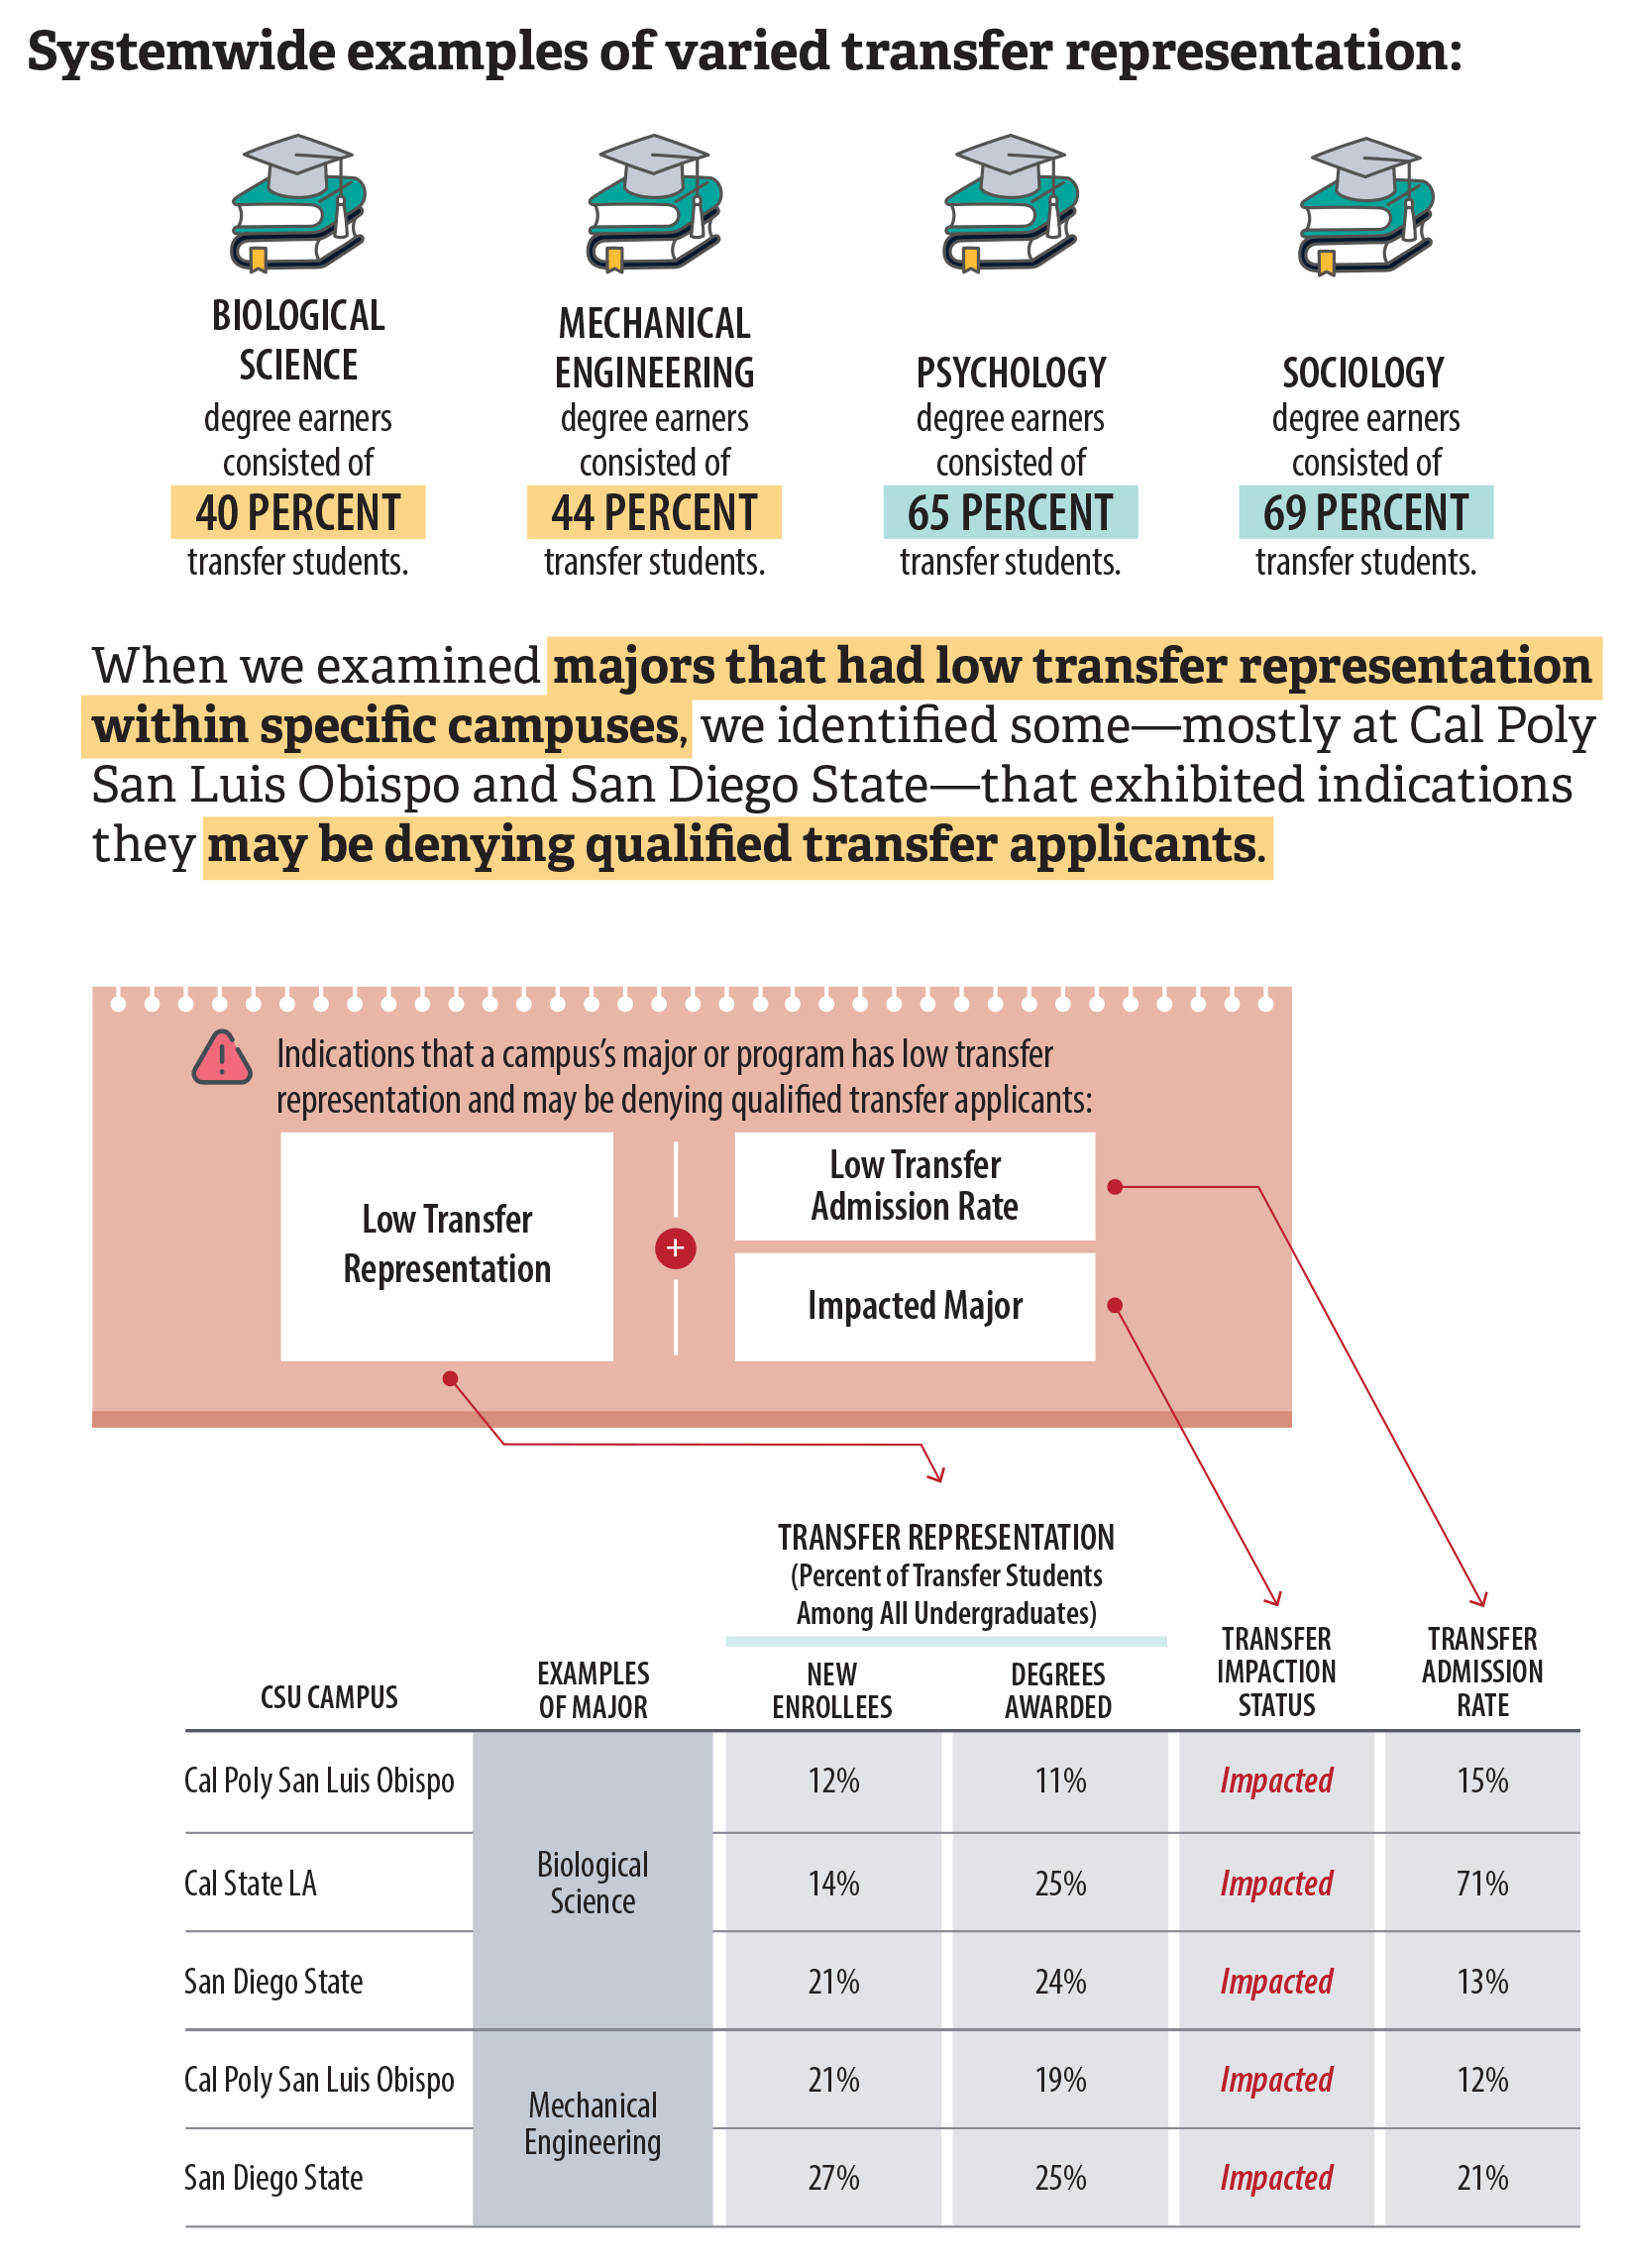
Figure 10
Transfer Representation Varied Significantly Among Specific Majors at CSU Campuses
Source: Analysis of CSU application, enrollment, and degree data.
Note: For the purpose of this graphic, we calculated levels of transfer representation and admission rates using data from 2018 through 2023, meaning that the totals and percentages cover five academic years. Further, we calculated transfer representation among only students with California residency.
Figure 10 is a diagram that shows that transfer representation varied significantly among specific majors at CSU campuses and that some majors with low transfer representation may be denying qualified transfer applicants. The top of the graphic shows that systemwide, CSU majors such as biological science and mechanical engineering had lower transfer representation than other majors did, such as psychology and sociology. Below those examples, the graphic explains that when examining majors that had low transfer representation, we identified some that exhibited indications that they may be denying qualified transfer applicants—such as the majors being impacted and having a low transfer admission rate. A table provides specific examples of impacted biological science and mechanical engineering majors at certain CSU campuses and shows their transfer representation percentages, their impaction status, and their transfer admission rates.
In response to our questions about lower transfer representation in certain campuses and majors, CSU officials explained that using new student enrollment data to measure transfer representation is problematic because many freshmen change majors after they initially enroll. For example, the associate vice president for enrollment management at San Diego State provided us with a student migration dashboard for the campus that showed that freshmen migrate out of STEM majors at higher rates than they do for other majors. Even so, when we analyzed graduation data—which considers only those students who ultimately earned a degree—we still found that certain CSU majors, such as biological sciences at San Diego State, awarded fewer than one‑third of their degrees to transfer students. In other words, transfer representation remained low for many majors even when we adjusted for freshmen changing their majors.
One more factor that could affect a campus’s or major’s level of transfer representation is the number of qualified transfer applicants. If a campus or major with low transfer representation also denies qualified transfer applicants, it may indicate that the campus or major is not adequately prioritizing transfer applicants compared to freshmen applicants. Determining whether transfer applicants are qualified for admission is complicated because campuses and majors use different approaches to assessing qualifications. Although transfer applicants to CSU are generally qualified if they meet the minimum eligibility requirements that the text box shows, impacted campuses and majors may impose supplemental admission criteria to further screen applicants. The very fact that a campus or major is impacted suggests that it is competitive and more likely to deny even applicants who exceed CSU’s minimum eligibility requirements. In addition, when a campus or major has a low admission rate—meaning it denies most transfer applicants—it is another indication that the campus or major may be denying applicants who meet its supplementary criteria.
We assessed whether certain impacted campuses and majors were denying qualified applicants. Figure 10 includes some examples of majors that are impacted and that had low transfer representation—among both new enrollees and degrees awarded—and low transfer admission rates. Based on these indicators and other factors, including conversations with campus officials and our analysis of other available data, we believe that Cal Poly San Luis Obispo and certain impacted majors within other campuses may have denied transfer applicants that met their supplementary admissions criteria. For example, Cal Poly San Luis Obispo denied 81 percent of transfer applications during our audit period, with about 9,400 of those denied applications reporting grade point averages (GPAs) of 3.6 or higher. Although we did not formally audit Cal Poly San Luis Obispo, when we followed up with the campus about some of our findings, its vice president of strategic enrollment management confirmed that the campus has not offered admission to all qualified transfer applicants—meaning applicants who were minimally eligible and also met its campus‑ and major‑specific admissions requirements. The vice president attributed this outcome to high application demand and limited capacity in certain majors, such as business and computer science, and added that the campus has offered admission to all qualified applicants in many other majors and to the vast majority of qualified applicants who are considered local to the campus. Similarly, San Diego State’s associate vice president for enrollment management acknowledged that some impacted majors, such as biological sciences, have denied transfer applicants who meet the major’s admissions requirements, although campus officials identified that recent trends show higher transfer admission rates in Fall 2023 and 2024, including in high‑demand majors.
Ultimately, it is incumbent on the CSU Chancellor’s Office to identify whether a particular campus or major has low transfer representation and, if so, to ensure that the campus or major is offering admission to as many qualified transfer applicants as possible. In the next section, we discuss ways in which the CSU Chancellor’s Office could explore increasing transfer representation in certain campuses and majors, even when limited capacity exists. Doing so would be consistent with the Legislature’s intent that the transfer system be implemented in such a way as to ensure the successful transfer of students to CSU and UC, including the campus and major of their choice, if academic performance is satisfactory.
When Limited Capacity Exists, CSU Can Better Prioritize the Admission of Transfer Students
As the text box describes, three main factors affect enrollment capacity. Taking all three factors into account, CSU has capacity for enrollment growth, although not evenly distributed across all its campuses. For example, CSU projected in January 2023 that it would have budget capacity to enroll at least 25,000 additional California resident students by the end of academic year 2022–23. However, most of that additional budgeted capacity is at seven non‑impacted CSU campuses, primarily located in Northern California, including Chico State University (Chico State); California State University, East Bay (Cal State East Bay); California State Polytechnic University, Humboldt (Cal Poly Humboldt); Cal Maritime; San Francisco State University (San Francisco State); Sonoma State University (Sonoma State); and California State University Channel Islands (CSU Channel Islands).
Three Main Factors Affect Enrollment Capacity
The physical capacity of a campus is determined by the number of people a campus is able to accommodate spatially.
The operational capacity of a campus is determined by the number of faculty and staff.
The budgeted capacity of a campus is determined by the number of full-time students whom the campus can serve with the amount of state funding it receives.
Source: CSU capacity study and public reports.
Shifting funding from campuses with budgetary capacity to impacted campuses could increase the number of transfer students that CSU enrolls. CSU has developed a plan to accommodate enrollment growth at its impacted campuses: in January 2023, it published the Enrollment Target and Budget Reallocation Plan with an explicit goal to reallocate funding from campuses not meeting funded enrollment targets to those that have been meeting them. If CSU achieves this goal, impacted campuses that currently deny many transfer applicants—such as Cal Poly San Luis Obispo—could have more room to accept some of those students.
CSU could make the most effective use of capacity increases—and potentially of the capacity it already has—by establishing an explicit transfer representation goal for its campuses and their programs. As we describe in the Introduction, state law seeks to ensure that adequate spaces are reserved for transfer students by establishing a metric for upper‑division enrollment, but it does not formalize a metric specifically related to transfer enrollment—such as the one‑third transfer representation goal we discuss throughout this chapter. Further, CSU’s assistant vice chancellor of enrollment management services stated that CSU does not explicitly maintain such a transfer representation goal or use it for admission purposes. For example, the assistant vice chancellor for finance and budget administration confirmed that the CSU Chancellor’s Office provides campuses with an overall funded enrollment target for resident students, but it does not provide campuses—including Cal Poly San Luis Obispo—with any targets for enrolling a certain number of transfer students specifically.
In addition, San Diego State provided examples of its program‑level enrollment targets for academic year 2022–23 that showed the targets themselves were below one‑third for transfer students in some impacted majors like biological science and computer science. The associate vice president for enrollment management at San Diego State provided context for these targets, including various factors—such as being asked to enroll more students than anticipated—that led the campus to increase its overall enrollment target for freshmen students but not for transfer students that year. The vice president noted that increasing upper‑division capacity typically requires more time to plan and hire faculty than increasing lower‑division capacity does. Even so, these types of challenges underscore the potential benefits of having a mechanism in place to monitor transfer representation and a plan to increase transfer student enrollment in particular campuses and programs when warranted.
CSU system officials expressed concerns that enrolling additional transfer students might disadvantage freshmen. When limited capacity exists, enrolling a greater number of transfer students could mean denying more freshmen applicants in certain campuses or majors—although not necessarily systemwide. Although state law provides that CSU and UC must achieve the upper‑division enrollment goal that we explain in the Introduction through programs aimed at increasing the numbers of qualified CCC transfer students without denying eligible freshman applicants, state law also requires campus enrollment plans to include adequate spaces for community college transfer students in all undergraduate colleges or schools. The Legislature also intends that CSU and UC prioritize the admission and enrollment of CCC students who have met transfer requirements over students entering at the freshman or sophomore levels. Further, state law authorizes the CSU Chancellor’s Office to establish enrollment quotas for each campus and, in doing so, it is required to place primary emphasis on the allocation of resources at the upper‑division level in order to help accommodate CCC transfers. If a particular campus or major has been using an enrollment process that clearly favors freshmen at the expense of transfer students, changing that process may be reasonable.
CSU could also explore options to increase transfer representation that allow it to maintain the number of freshmen it enrolls. For example, the CSU Chancellor’s Office could work with campuses and majors that may be denying qualified transfer applicants despite having low transfer representation to identify why this situation is occurring and to ensure that the campuses are taking reasonable steps to accommodate transfer enrollment. As part of this process, CSU could consider prioritizing capacity increases for additional transfer enrollments rather than making room for transfer enrollments by reducing freshmen enrollments. Alternatively, from a systemwide standpoint, the CSU Chancellor’s Office could consider whether it could offset any reductions in freshmen enrollment at particular campuses or majors by increasing freshmen enrollment at campuses or majors with higher transfer representation.
Another way in which CSU can increase transfer students’ access to their preferred campuses and majors is by continuing to seek opportunities to prioritize local transfer students for admission. In accordance with provisions such as the Budget Act of 2017, CSU has a process that requires campuses to give priority to local applicants who are eligible for transfer and seek to enroll in impacted programs. CSU’s process for prioritizing local students for admission allows each campus to determine the precise type and degree of local preference. For example, a 2023 CSU report stated that California State University, Fullerton (Cal State Fullerton) provided a GPA advantage of 0.4 to local transfer applicants. The report also stated that San Diego State selected local transfer applicants first in its ranking process, before any nonlocal applicant with equal preparation or GPA. These types of strategies help CSU continue to admit and enroll transfer students in line with the intent of state law.
UC Accepts More Than 75 Percent of Transfer Applicants, but Its Admission Rates Are Significantly Lower for Certain Campuses and Majors
Although UC admits fewer of its transfer applicants and has lower transfer representation than CSU does, it has nevertheless met its systemwide transfer representation goal. Figure 11 shows that most community college transfer students who apply to UC gain admission to at least one campus, although not necessarily to their preferred campus or major. Students may prefer a particular campus or major for a variety of reasons, including the potential future employment opportunities associated with earning a degree. They must also meet requirements specific to that campus or major, as we discuss in Chapter 2. To increase the likelihood of transfer students enrolling in their desired fields of study, UC could do more to monitor and prioritize their admission to certain competitive campuses and majors.
Figure 11
UC Accommodates Many Transfer Students but Can Improve Access to Some Campuses and Majors
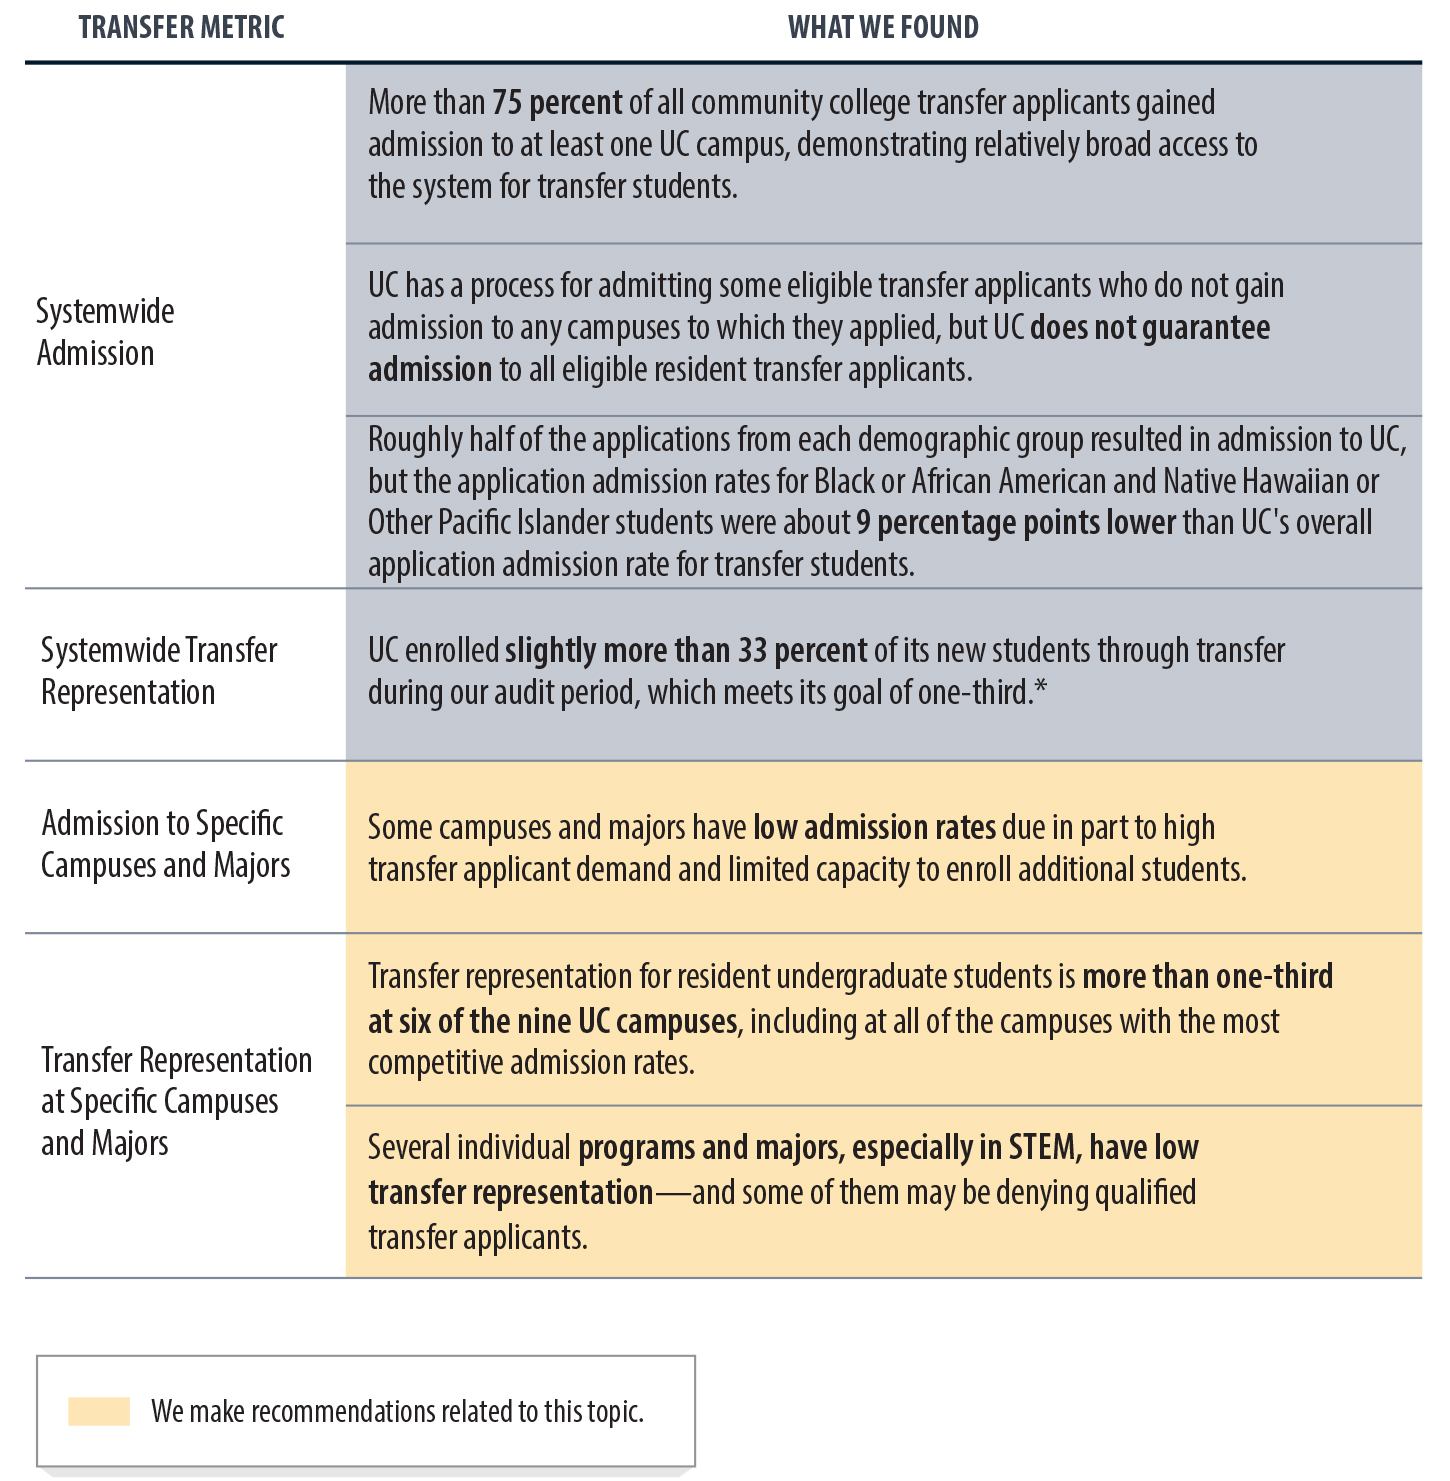
Source: Analysis of state law, the Master Plan, UC application and enrollment data, and other system documents.
* As we explain in the Introduction, we derived this goal—to enroll one‑third of new resident undergraduates through transfer—from a UC goal that is related to an upper‑division enrollment requirement in state law.
Figure 11 includes analysis of four transfer metrics that we discuss in our report as they relate to UC—systemwide admission, systemwide transfer representation, admission to specific campuses and majors, and transfer representation at specific campuses and majors. For example, with regard to systemwide admission, we found that more than 75 percent of all community college transfer applicants gained admission to at least one UC campus during our audit period. In terms of transfer representation, the system enrolled slightly more than 33 percent of its new resident undergraduates through transfer. However, we found that some individual campuses and majors have low admission and transfer representation rates. A key at the bottom of the graphic indicates that we make recommendations related to these findings about UC campuses and majors.
UC Admits More Than 75 Percent of All Community College Transfer Applicants
UC admits proportionally fewer of its transfer applicants than CSU does. However, UC still admitted to at least one of its campuses more than 75 percent of the roughly 170,000 community college transfer students who applied for admission from academic years 2018–19 through 2022–23. Table C.1 in Appendix C shows that UC’s systemwide transfer admission rate remained relatively constant each year during this period.
In addition, the UC system as a whole met its transfer representation goal of enrolling two incoming resident freshmen for every one incoming resident transfer student during this period. As Figure 12 shows, most campuses met this goal as well.
Figure 12
UC Met Its Transfer Representation Goal as a System, but Representation Varies by Campus
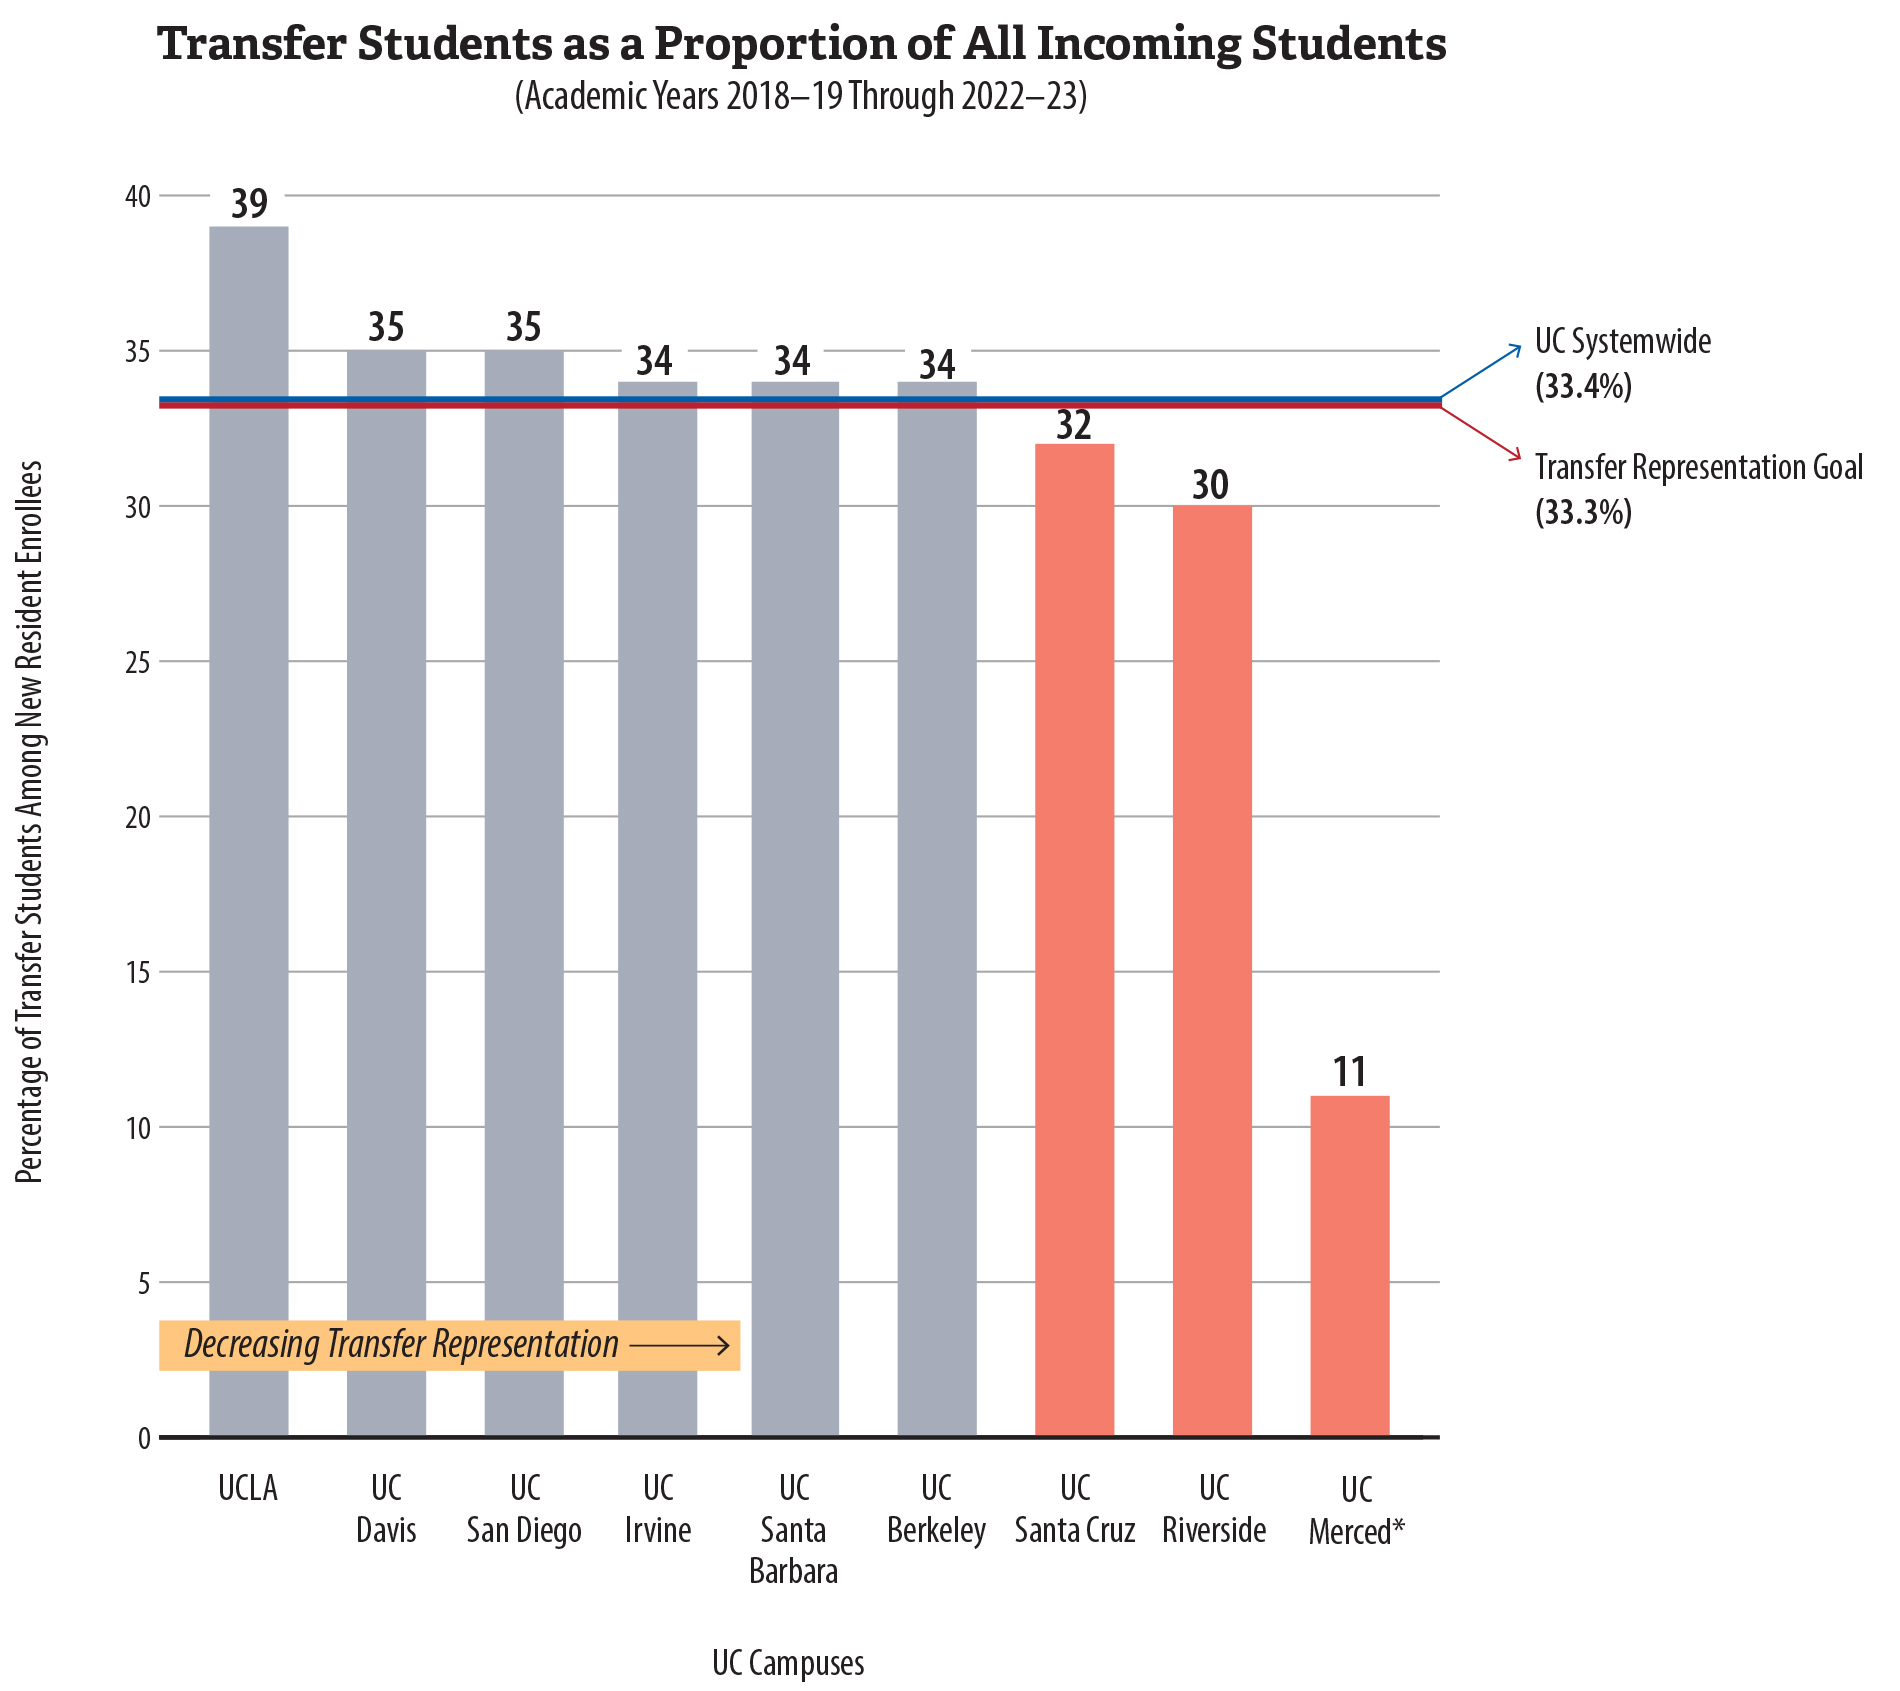
Source: Analysis of UC enrollment data from 2018–19 through 2022–23.
Note: Based on UC’s existing methodology, we calculated these ratios using only California residents and using all transfer students, even if those students did not transfer from community colleges. However, according to UC’s public dashboard, nearly 90 percent of UC’s transfer students are residents, and more than 90 percent of UC transfer students overall transfer from California community colleges.
* A UC report from November 2023 states that UC does not include UC Merced when calculating enrollment related to its existing systemwide goal because, as a relatively new UC campus, UC Merced is still working to develop the academic programs, upper‑division capacity, and close relationships with community colleges that are necessary to attract and enroll resident transfer students equal to half of its incoming freshman class.
Figure 12 is a bar chart consisting of nine bars that show each UC campus’s percentage of transfer students among its new resident enrollees, with the campuses presented from left to right in decreasing order of transfer representation. One horizontal line shows that, systemwide, UC’s transfer representation is 33.4 percent, and another shows the transfer representation goal of 33.3 percent. UCLA is the UC campus with the largest share of transfer students among incoming resident undergraduates, at 39 percent. Three campuses fall under the 33.3 percent goal: UC Santa Cruz is at 32 percent, UC Riverside is at 30 percent, and UC Merced is at 11 percent.
One explanation for the variances in transfer representation among UC campuses is that many transfer students may choose not to apply to or enroll at certain campuses. For example, during our audit period, University of California, Riverside (UC Riverside); University of California, Santa Cruz (UC Santa Cruz); and University of California, Merced (UC Merced) admitted some of the highest percentages of transfer applications in the UC system—67 percent, 64 percent, and 59 percent, respectively. However, their rates of transfer representation were the lowest in the system, in part because many of the students they admitted did not enroll at those campuses. In fact, according to its 2023 Multi‑Year Compact Annual Report, UC excludes its Merced campus when determining whether it has achieved its transfer representation goal because, as a relatively new campus that opened in 2005, UC Merced is still working to develop academic programs, upper‑division capacity, and relationships with community colleges. By contrast, as Table C.2 in Appendix C shows, UCLA had the lowest transfer admission rate, but it also had the second highest transfer enrollment rate. Moreover, UCLA had the highest transfer representation among all UC campuses, as Figure 12 shows.
As we previously explain in Figure 7, different stages in the transfer process may contribute to gaps in transfer outcomes across demographic groups. For example, in the cohorts we reviewed, Hispanic or Latino students represented about 49 percent of students who intended to transfer but made up just 29 percent of students who applied to UC—a 20 percentage point gap. Moreover, gaps exist in transfer outcomes between certain demographic groups of students who applied to UC and students whom UC admitted. Table C.3 in Appendix C shows UC’s admission rates by demographic group for community college transfer applicants during our audit period. Most notably, UC campuses admitted 39 percent of transfer applications from Black or African American and Native Hawaiian or Other Pacific Islander community college students in comparison to 48 percent of transfer applications from all community college students. These gaps generally align with UC’s public dashboard, which shows, on average, a 10 percentage point difference in the percentage of Black or African American and Native Hawaiian or Other Pacific Islander transfer applicants who gained admission somewhere in the system compared to all applicants.8
When we asked the UC Office of the President about these gaps, the executive director for undergraduate admissions provided several possible explanations. She asserted that the small number of Black or African American applicants compared to other populations may cause the disparity gap. As Table C.3 in Appendix C reveals, UC transfer applications from community college students who identified as Black or African American comprised only 3 percent of the roughly 687,000 transfer applications UC received during the audit period. The executive director added that other possible causes likely relate to courses that prepare students for their major, GPAs, and similar factors used in admissions.
UC’s Transfer Admission Rates Are Significantly Lower for Certain Preferred Campuses and Majors
Although UC admits a significant portion of transfer applicants to at least one campus, transferring to specific campuses and majors can be more challenging because of competitiveness within the UC system. UC transfer applicants do not specify a preference among the multiple UC campuses to which they may apply. However, factors such as admission rates and levels of transfer representation indicate that many transfer applicants are likely unable to access their preferred campus and major.
Some UC campuses have particularly low rates of admission for transfer students. UC Berkeley and UCLA had the lowest transfer admission rates during our audit period, admitting just 25 percent of all transfer applications. In contrast, UC Riverside had the highest admission rate—about 67 percent of all transfer applications. Table C.2 in Appendix C includes the total number of transfer applications campuses received from 2018 through 2023 and their admission rates based on those applications.
Some majors also have particularly low admission rates, even at campuses with higher admission rates overall. For example, UC Santa Barbara admitted only 11 percent of transfer applications for its computer science program during our audit period, whereas it admitted 58 percent of all transfer applications. Although UC does not have a process similar to CSU’s process for determining which campuses and majors are impacted, UC maintains a public dashboard that shows transfer admission data for specific majors. Its dashboard shows that in 2023, the computer science major had a 5 percent transfer admission rate at UC Berkeley and UCLA, 26 percent at UC Riverside, and 45 percent at University of California, Davis (UC Davis).
When resident transfer applicants who meet UC’s minimum systemwide eligibility requirements do not gain admission to any campuses and majors to which they apply, UC has a transfer referral process for admitting those students at a different campus. However, that process is not as robust as CSU’s redirection process. The text box shows UC’s minimum eligibility requirements for upper‑division transfer students. Meeting these minimum requirements does not guarantee that a student will be able to transfer into the UC system, which is the guarantee that CSU makes to all California residents through its redirection process. During our audit period, UC offered admission to about half of the students in its transfer referral pool. In addition, UC’s policy for transfer applicants during our audit period was to offer them referrals to its referral pool only if they were California residents who did not apply to UC Merced, were not offered admission to any other UC campuses to which they applied, and had last attended a California community college.
UC’s Minimum Eligibility Requirements for Upper-Division Transfer Students
- Complete a pattern of UC-transferable general education courses by the end of the spring term prior to fall enrollment at UC.
- Complete at least 60 semester (90 quarter) units of UC‑transferable credit.
- Earn at least a 2.4 GPA in UC-transferable courses (2.8 for nonresidents).
- Complete the courses needed for the intended major with the minimum grades.
UC does not guarantee admission to all students fulfilling these requirements.
Source: Regulations of the UC Academic Senate and UC admissions website.
According to data the UC Office of the President provided us, UC’s transfer referral pool during our audit period totaled nearly 1,900 students out of about 17,000 potentially eligible students—about 11 percent. Participating UC campuses—UC Riverside, UC Santa Cruz, and UC Merced—offered admission to 946 of these 1,900 students during the same period, or slightly more than half of the transfer referral pool. However, just 200 of the 946 students ultimately enrolled at UC. The executive director of undergraduate admissions at the UC Office of the President explained that one of the main reasons campuses cannot offer admission to more students in the transfer referral pool is that the campuses lack the capacity to accommodate them, sometimes because of limited space in certain majors. The executive director added that students’ lack of major preparation is another barrier.
Another indicator that some transfer students have faced challenges accessing their preferred campus and major is that certain programs of study, often in STEM disciplines, are disproportionately composed of freshmen. Although UC and most of its campuses met the transfer representation goal of enrolling at least one‑third of new resident students through transfer, certain disciplines—such as life sciences and engineering—accommodate far fewer transfer students compared to freshmen and do not meet this goal. In contrast, transfer students represent the majority of undergraduates in some non‑STEM disciplines, such as humanities. Although we observed similar trends at CSU, certain UC STEM disciplines have lower transfer representation than any of CSU’s disciplines. For specific UC campuses and the majors that comprise these STEM disciplines, disparities in transfer representation can be even more pronounced, as Figure 13 shows.
Figure 13
Transfer Representation Varied Significantly Among Specific UC Disciplines and Majors
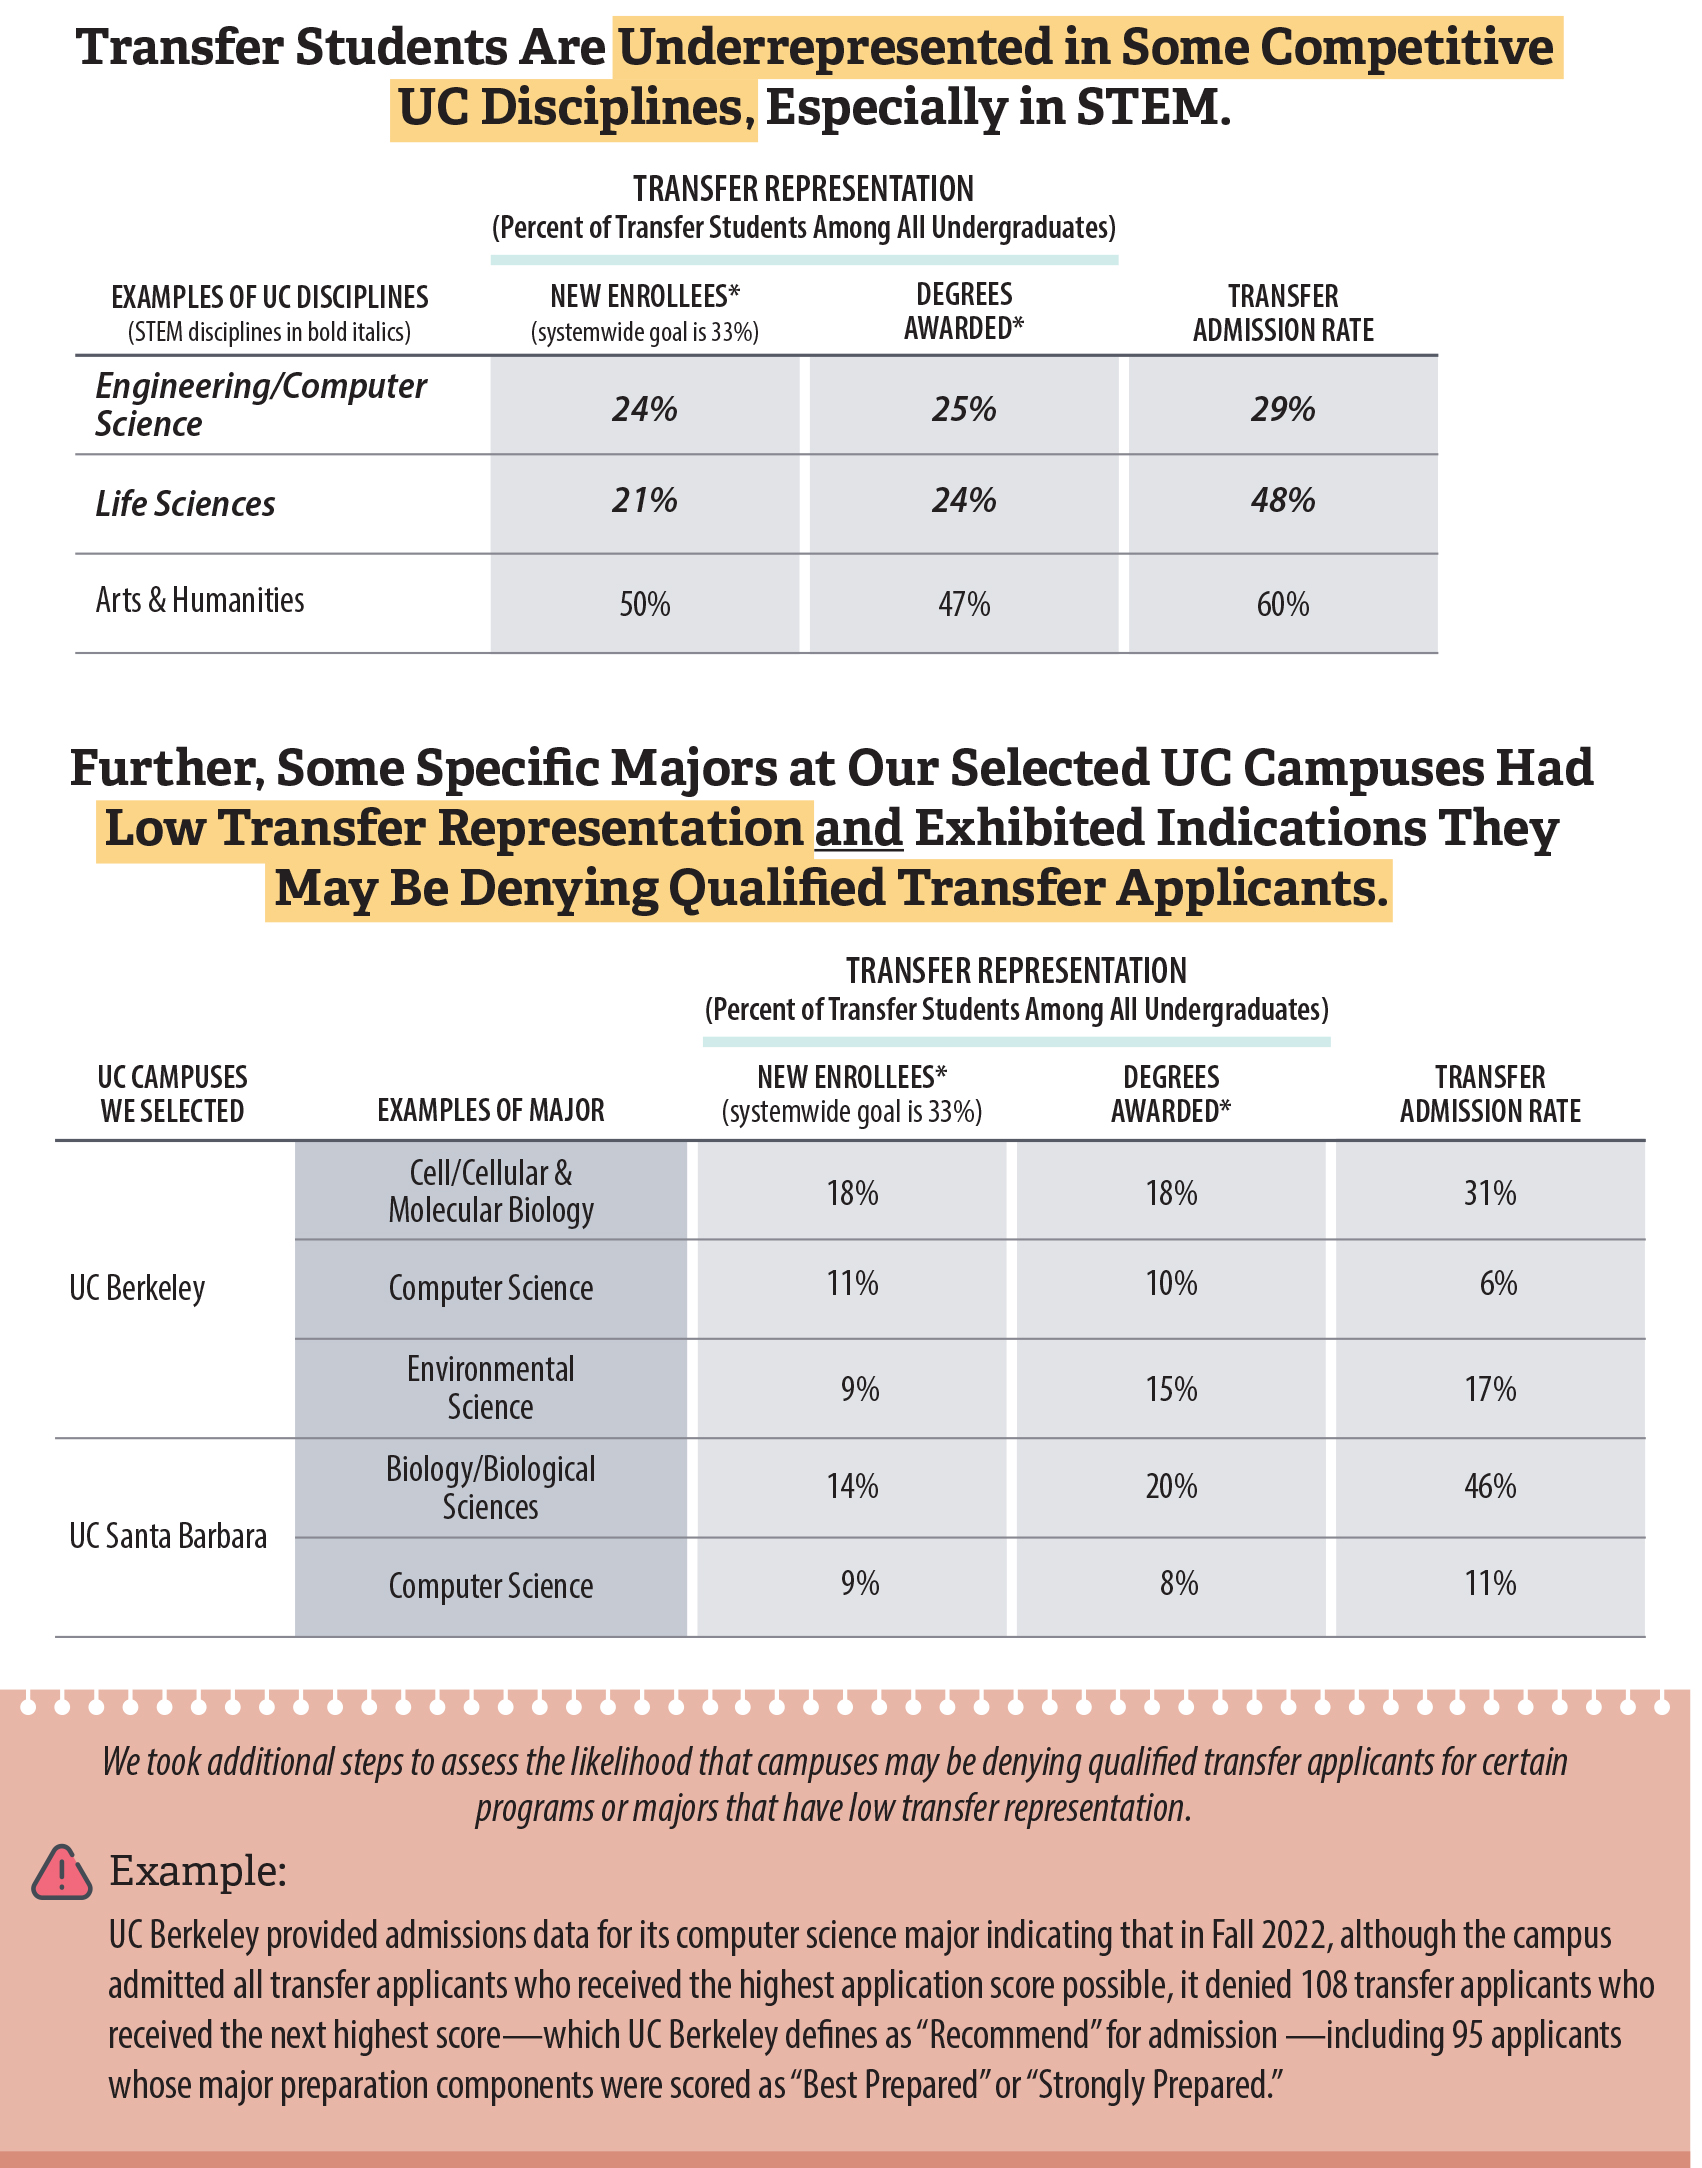
Source: Analysis of UC application data, unaudited UC‑provided data on degrees awarded, and unaudited data from UC Berkeley and UC Santa Barbara. All percentages are for academic years 2018–19 through 2022–23.
* We calculated the transfer representation of new enrollees using UC application data, which UC raised concerns about, as we explain in our report text. Therefore, we also obtained and presented transfer representation of UC degrees awarded, which are unaudited data from the UC Office of the President and from UC Berkeley’s and UC Santa Barbara’s public dashboards. We limited all of these calculations to California resident freshmen and resident transfer students based on UC’s existing methodology for calculating transfer representation, except for UC Santa Barbara’s transfer representation of degrees‑awarded calculations, which include all students, because of limitations with filtering the public dashboard by residency.
Figure 13 is a diagram that shows that transfer representation varied significantly among specific UC disciplines and majors and that some majors with low transfer representation may be denying qualified transfer applicants. The top of the graphic shows that systemwide, UC disciplines such as engineering/computer science had lower transfer representation than other disciplines did, such as arts & humanities. Below those examples, the graphic explains that when examining majors that had low transfer representation at our two selected UC campsues, we identified some that exhibited indications that they may be denying qualified transfer applicants. A table provides specific examples of majors such as computer science at UC Berkeley and UC Santa Barbara and shows their transfer representation percentages and their transfer admission rates. The bottom of the graphic includes an example from UC Berkeley in which the campus provided admissions data for its computer science major in Fall 2022. These data indicated that, although the campus admitted all transfer applicants who received the highest application score possible, it denied 108 transfer applicants who received the next highest score—which UC Berkeley defines as “Recommend” for admission.
UC Office of the President officials challenged the validity of using its data from students’ initial applications to measure transfer representation at the major‑ or discipline‑level. The UC Office of the President’s executive director for undergraduate admissions stated that UC campuses do not necessarily admit freshmen directly into a major, whereas they often admit transfer students this way. She stated that because many freshmen enter UC with majors undeclared or eventually enroll in majors different from those they listed on their initial application, enrollment data will change over time. However, when we followed up with the UC Office of the President and the campuses we reviewed to determine whether they had similar data from later in students’ time at UC, the data they provided generally showed the same trends we had previously identified. For instance, the UC Office of the President’s data show that certain STEM disciplines awarded a far smaller proportion of their degrees to transfer students than did non‑STEM disciplines. Figure 13 provides examples of majors for which multiple sources of data revealed low transfer representation.
The UC Office of the President’s executive director for undergraduate admissions told us that one likely reason STEM fields have lower transfer representation is that those disciplines require more major preparation courses that are challenging for students to fulfill at the community college level. Nevertheless, the executive director also confirmed that some transfer applicants who are qualified—meaning that they meet UC’s minimum eligibility requirements and also have the preparation required for the specific major to which they are applying—are denied admission to certain campuses and majors, in part because of those campuses’ and majors’ competitiveness and limited capacity. We identified further indications that some majors may be denying admission to qualified transfer applicants even though those majors have low transfer representation, as Figure 13 shows. If a UC campus denies qualified transfer applicants in a certain major and it also enrolls relatively few transfers compared to freshmen in that major, it raises questions about whether the campus is doing everything it reasonably can to accommodate qualified transfer students.
Ultimately, neither the UC system as a whole nor the campuses we reviewed have established goals or mechanisms to monitor transfer representation at the major or program level. As a result, they are unable to demonstrate whether they are making reasonable attempts to accommodate transfer students in competitive fields of study. Doing so would be consistent with the Legislature’s intent, which we describe in the Introduction, that the transfer system be implemented in such a way as to ensure the successful transfer of students to CSU or UC, including to the campus and major of their choice, if academic performance is satisfactory. It would also be consistent with the intent of the Legislature that campus enrollment planning processes provide for the equitable treatment of eligible entering freshmen and eligible community college transfer students with regard to accommodation in majors.
Despite Its Capacity Challenges, UC Could Better Prioritize the Admission of Transfer Students
Limited enrollment capacity contributes to students facing challenges gaining admission to their preferred UC campuses and majors. According to the UC Office of the President’s executive advisor for academic planning and policy development, UC has limited room to expand the total number of students it enrolls at most of its campuses. As we discuss earlier, physical capacity, operational capacity, and budgeted capacity are factors affecting overall enrollment capacity. For example, both UC Berkeley and UC Santa Barbara have been involved in litigation with local governments and advocacy groups that challenge those campuses’ enrollment growth relative to the amount of housing available for their students. In addition, specific majors or programs at these and other campuses have limited capacity relative to available faculty or classroom space.
In the face of these challenges, UC has established plans to increase capacity where feasible. According to a systemwide capacity plan that UC published in July 2022, UC projects to grow enrollment by more than 23,000 full‑time equivalent resident students before 2030, although the plan does not specify how many of these students should be transfer students. UC campuses have different responsibilities for accommodating this planned growth. For example, the plan states that UC Merced and UC Riverside will accommodate from 30 percent to 35 percent of the undergraduate enrollment growth. Meanwhile, UC Berkeley, UCLA, and UC San Diego will increase capacity primarily by enrolling a larger percentage of California residents and fewer nonresidents. Additionally, the May 2022 UC compact with the Governor’s administration calls for 1 percent annual enrollment growth systemwide for all resident students from academic years 2023–24 through 2026–27 in exchange for state funding to accommodate that growth. The compact specifies that 15 percent of this growth should occur at UC Berkeley, UCLA, and UC San Diego. The compact also specifies that UC’s overall enrollment growth should be consistent with its existing two‑to‑one transfer representation goal.9
To achieve its broad enrollment goals, the UC Office of the President coordinates with campuses to establish specific enrollment targets each year. These campus enrollment targets are essential because they guide the campuses’ decisions about how many new students to admit. Each campus receives finalized targets from the UC Office of the President for both freshmen and transfer resident enrollees, which helps the UC Office of the President ensure that campuses are working to meet UC’s systemwide transfer representation goal. Nonetheless, these campus‑level targets do not always achieve the transfer representation goal at each campus. Further, the executive advisor for academic planning and policy development at the UC Office of the President stated that it does not specify any targets at the major or program level, nor does it oversee each campus’s process for distributing its overall campus enrollment target among its specific departments or majors.
Campuses’ approaches to achieving these broad enrollment targets vary, which is likely one contributing factor to some majors having low transfer representation. For example, UC Berkeley sets enrollment targets for incoming undergraduates for each college within the campus and for some majors that the college deans determine to have limited capacity. These targets include a specific number of transfer students to enroll as new students but not for all majors. However, when we reviewed these targets for certain colleges and majors, we found that many of them did not meet the one‑third transfer representation goal.10 For instance, within its College of Letters and Sciences, UC Berkeley did not have a major‑specific enrollment target for freshmen entrants into computer science until Fall 2022, even though it had a relatively low enrollment target for transfer entrants that ranged from 37 to 58 students each year from 2018–19 through 2022–23. UC Santa Barbara’s director of institutional research, planning, and assessment stated that the campus does not set specific enrollment targets for each major except within the College of Engineering. The director provided a table of enrollment targets for new transfer students in this college, and it indicated that UC Santa Barbara had planned to enroll fewer than 60 total transfer students in computer science over the five‑year period from 2018 through 2022.
UC Office of the President officials expressed concerns that enrolling additional transfer students at the program or major level would require UC to deny enrollment to eligible freshmen applicants, especially if it did so for highly competitive programs or majors with limited capacity. As we acknowledge in the previous section about CSU, when limited capacity exists, enrolling a greater number of transfer students could mean denying more freshmen applicants in certain campuses or majors—but not necessarily systemwide. State law provides that the CSU and UC systems must not only achieve a specific upper‑division enrollment goal through programs aimed at increasing the numbers of qualified community college transfer students without denying eligible freshman applicants, but the law also requires campus enrollment plans to include adequate spaces for community college transfer students in all undergraduate colleges or schools. As we note in the Introduction, the Legislature has further declared its intent that CSU and UC prioritize the admission and enrollment of CCC students who have met transfer requirements over students entering at the freshman or sophomore levels. If a particular campus or major has been using an enrollment process that clearly favors freshmen at the expense of transfer students, changing that process may be reasonable.
UC could explore options to increase transfer representation within particular campuses or majors that allow it to maintain the total number of freshmen it enrolls systemwide. For example, UC could consider enrolling more transfer students in particular campuses or majors and offsetting any subsequent reductions in freshmen enrollment in those campuses or majors with increases in freshmen enrollment at other campuses or majors. Further, specific campuses or majors could consider prioritizing capacity increases to accommodate additional transfer students without decreasing the number of freshmen they enroll.
To ensure that campuses adequately prioritize transfer students for the space they do have available, the UC Office of the President could formalize its systemwide transfer representation goal and extend it to the level of campuses and their specific majors or programs. It could monitor campuses’ progress toward meeting that goal using degree data, enrollment data, or another appropriate data source. The UC Office of the President could then follow up with campuses that have concerning transfer representation trends, such as trends showing that competitive majors have low transfer representation and may be denying qualified transfer applicants. It could assess the reasons campuses provide for those trends and, when warranted, work with them to establish a plan to improve transfer representation by adjusting their admissions and enrollment processes to enroll additional transfer students or by taking other actions. For example, if a campus has one or more programs that are denying qualified transfer applicants despite having low transfer representation, the UC Office of the President could work with the campus to determine whether it is feasible to increase upper‑division capacity in those programs or to take other actions to enroll more transfer students.
Recommendations
CCC Chancellor’s Office
To assess and improve the State’s efforts to help community college students transfer, the CCC Chancellor’s Office should establish by September 2025 a goal transfer rate and a process for measuring and reporting that rate as it applies to the statewide system and to individual community colleges. The process for measuring the transfer rate should include identifying the proportion of transfer‑intending community college students who ultimately transfer successfully by using a methodology that the Chancellor’s Office determines best captures students’ intent to transfer and allows for timely analysis. The Chancellor’s Office should also incorporate this goal into any key strategic plans for the system.
To help community colleges improve their transfer rates, the CCC Chancellor’s Office should establish a process by September 2025 for identifying any specific best practices at community colleges that have had a measurable impact on the colleges’ transfer rates and sharing these practices with all colleges.
CSU Chancellor’s Office and UC Office of the President
To ensure that their campuses and degree programs adequately prioritize transfer students, the CSU Chancellor’s Office and the UC Office of the President should establish and begin implementing procedures by September 2025 for monitoring and publicly reporting the ratio of community college transfer students to other undergraduates in their systems, campuses, and specific disciplines, programs, or majors. The procedures should establish the following:
- Specific goals for adequate representation of transfer students among all undergraduates, such as a goal that transfer students represent at least one‑third of new enrollees or graduating degree‑earners. The systems should work toward meeting these goals at the system level and, where feasible, at the campus level and at the level of campuses’ specific disciplines, programs, or majors.
- A formal and documented method to identify when campuses or their specific disciplines, programs, or majors are below the goals and, when appropriate, to work with those campuses or programs to determine the possible causes for the low transfer representation and document plans for increasing it. For example, these plans could include the campus or program enrolling additional transfer students by expanding its upper‑division capacity or adjusting its enrollment targets, if doing so is feasible. In carrying out this process, the CSU Chancellor’s Office and the UC Office of the President should prioritize following up with the campuses or programs whose admissions processes may be denying qualified transfer applicants.
To best position the CSU and UC systems to admit and enroll more transfer students into their preferred degree programs, the CSU Chancellor’s Office and the UC Office of the President should establish formal processes by September 2025 for identifying the specific disciplines, programs, or majors where capacity increases at campuses would be most valuable. They should then prioritize those areas for future capacity increases. For example, both offices could use transfer representation data or data from their redirection or transfer referral processes to identify majors in which additional capacity would enable more transfer students to enroll.
Chapter 2
Variations in Requirements Across and Within the Three Systems Add Significant Complexity to the Transfer Process
Chapter Summary
- Prospective transfer students face complex transfer considerations, as Figure 14 shows. The Legislature and the State’s three higher education systems have designed transfer pathways in part to try to minimize this complexity.
- The Associate Degree for Transfer (ADT) offers important benefits to certain transfer students. However, only about one‑quarter of the students who transfer to CSU could take advantage of all of those benefits, in part because each community college may not offer every ADT, and each CSU campus may not accept every ADT.
- UC has not yet widely adopted the ADT model. Instead, it has established its own transfer options that do not provide the same level of benefits the ADT provides.
- Efforts to align curricula between CSU and UC are ongoing but have yet to make significant progress. UC could further streamline its transfer requirements either by widely adopting the ADT or by ensuring that its own transfer options emulate the ADT’s key benefits.
Students May Struggle to Meet Transfer Requirements Because of Differences Between Each System, Campus, and Major
As Figure 14 shows, community college students must navigate a complex series of decisions in preparation to transfer, particularly if they are considering applying to multiple campuses or majors. A key hurdle that transfer‑intending students often face is balancing various sets of curricular requirements, each tied to a distinct purpose. For example, the requirements for students to obtain associate degrees may be different than those they need to transfer to CSU and UC. Therefore, in some instances, students may decide to take courses that meet individual transfer requirements rather than those that would allow them to obtain an associate degree.
Figure 14
Students Face Many Potentially Complex Decisions When Preparing to Transfer
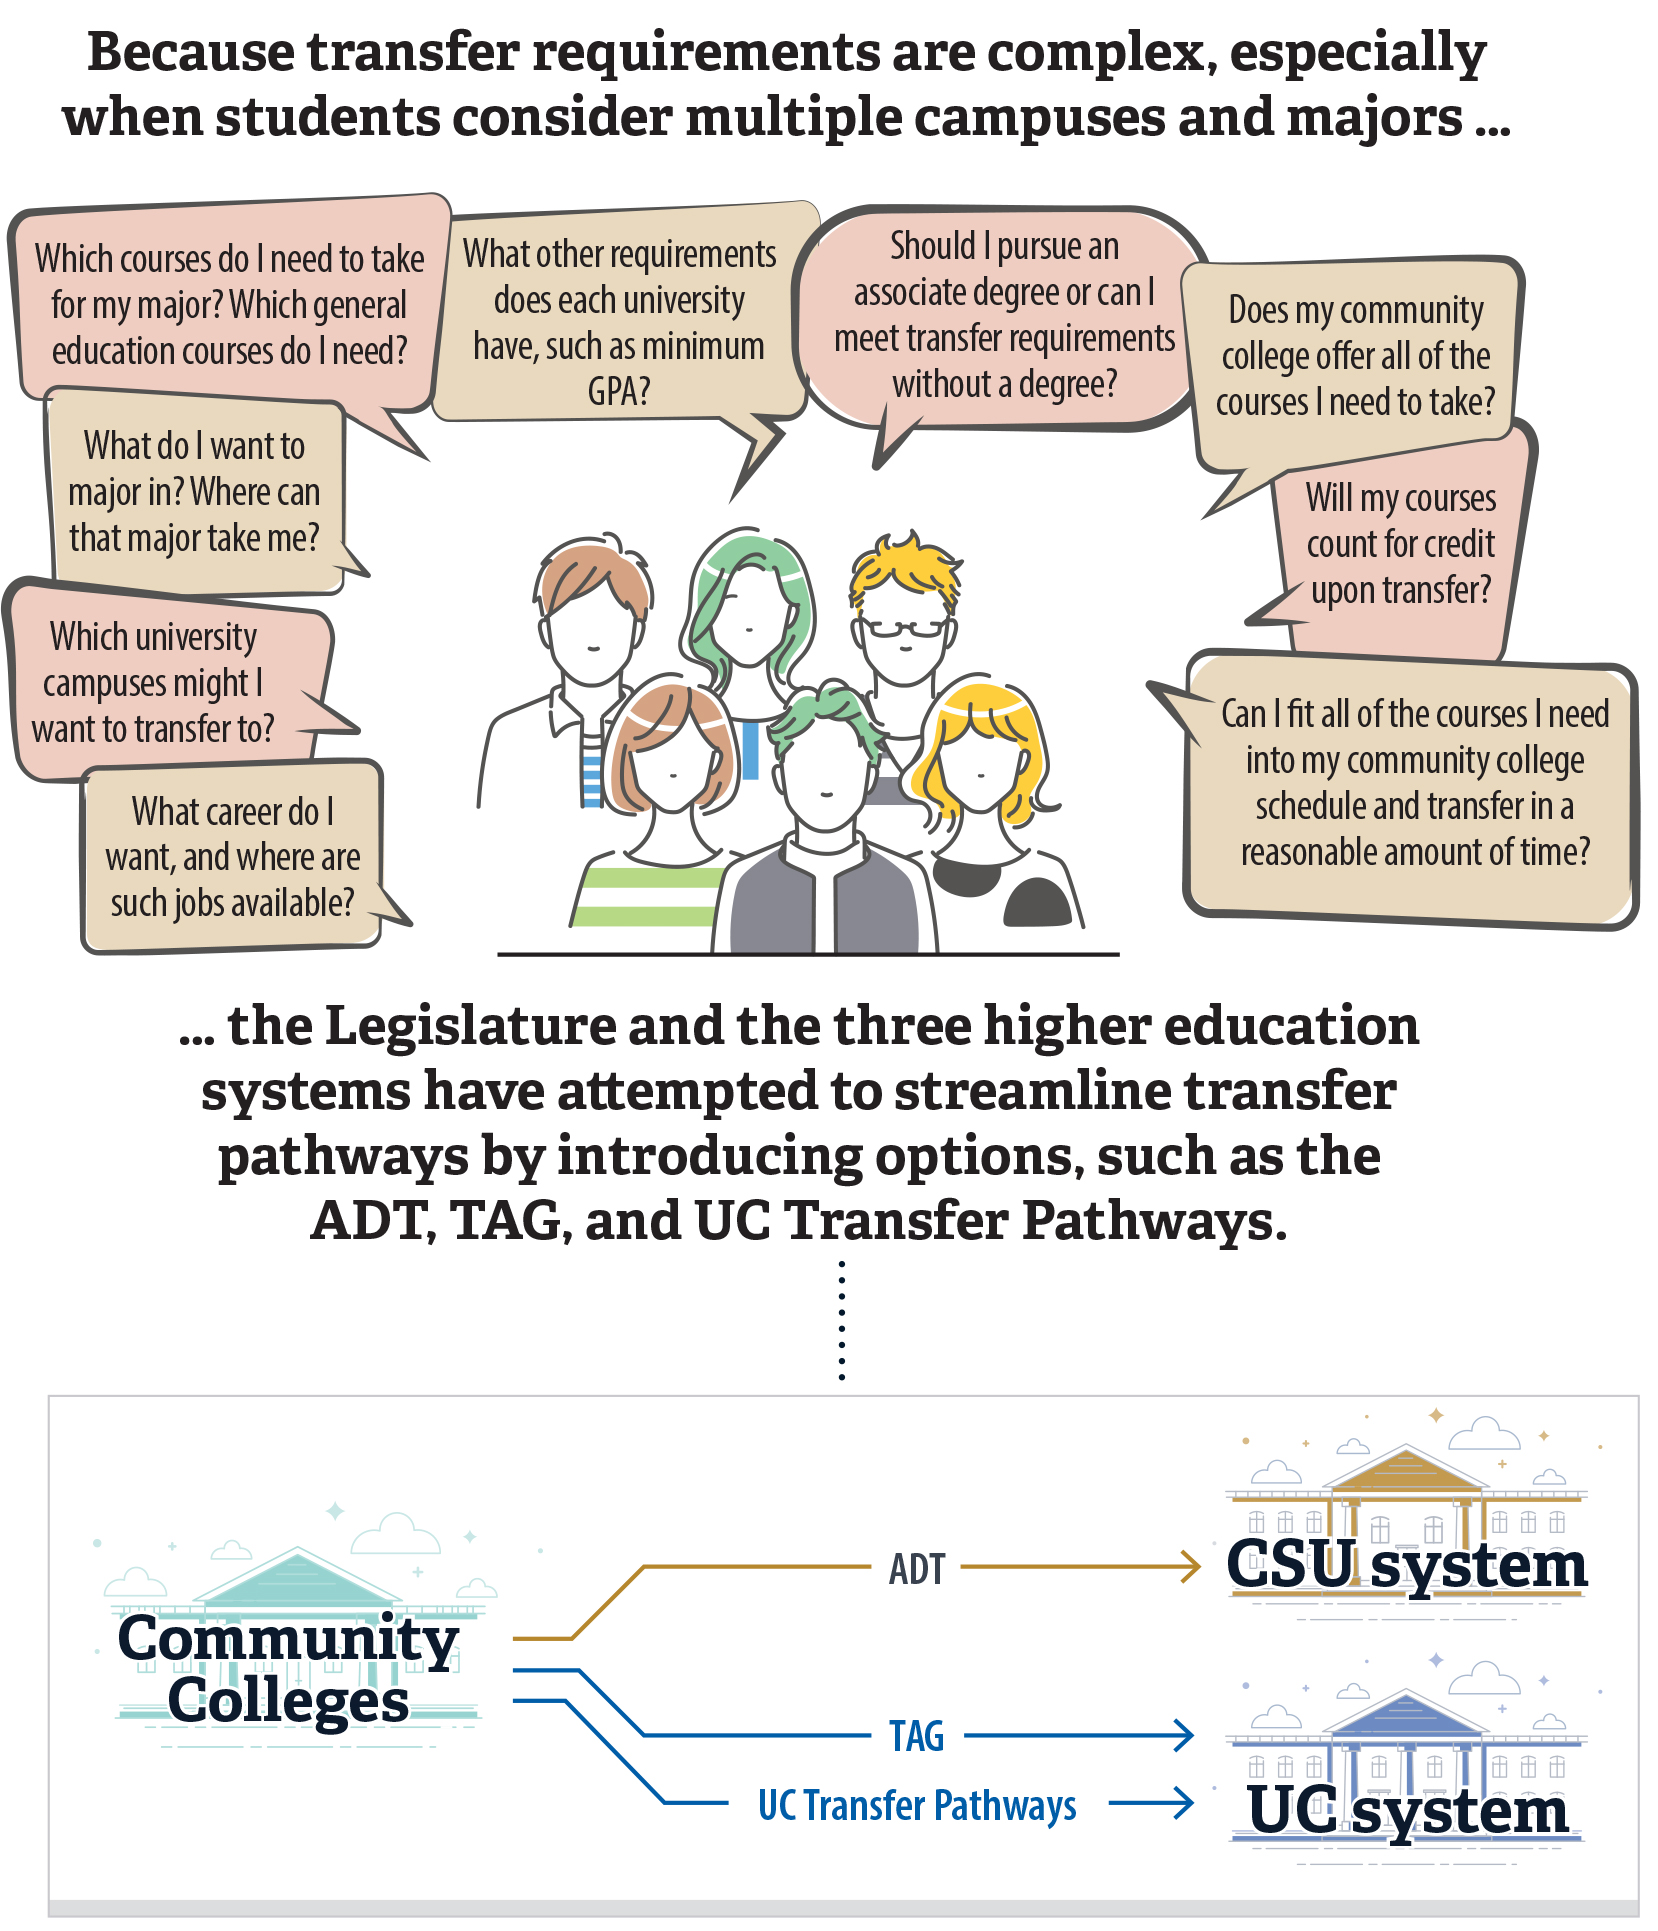
Source: Analysis of state law, course catalogs, student‑facing orientation materials and websites, and interviews with system and campus officials.
Figure 14 is an infographic that depicts the complexity of students’ transfer considerations, especially when students may apply to multiple campuses and majors. The graphic explains that the Legislature and the three higher education systems have attempted to streamline transfer pathways by introducing options such as the ADT, TAG, and UC Transfer Pathways. At the top of the graphic, to demonstrate the complex decisions that students may face when preparing to transfer, nine speech bubbles surrounding a group of students include the types of questions a transfer-intending student may need to consider. For example, one is, “Which university campuses might I want to transfer to?” Another reads, “Should I pursue an associate degree or can I meet transfer requirements without a degree?” Below this top portion of the graphic, a box depicts the key transfer options of the ADT for CSU, and TAG and UC Transfer Pathways for UC.
Additionally, CSU and UC transfer requirements often vary by campus and major. Major preparation courses—the lower‑division courses for a particular major—are a significant source of this complexity. Individual CSU and UC campuses sometimes require different lower‑division courses for the same major, as Figure 15 shows. Further, it is common for students to apply to multiple campuses: during our audit period, about 47 percent of CSU transfer applicants applied to two or more CSU campuses and 83 percent of UC transfer applicants applied to two or more UC campuses. As a result, students may need to take different community college courses to meet the specific requirements of each CSU or UC campus.
Figure 15
CSU and UC Campuses May Each Require Different Preparation Courses for Transfer to the Same Major
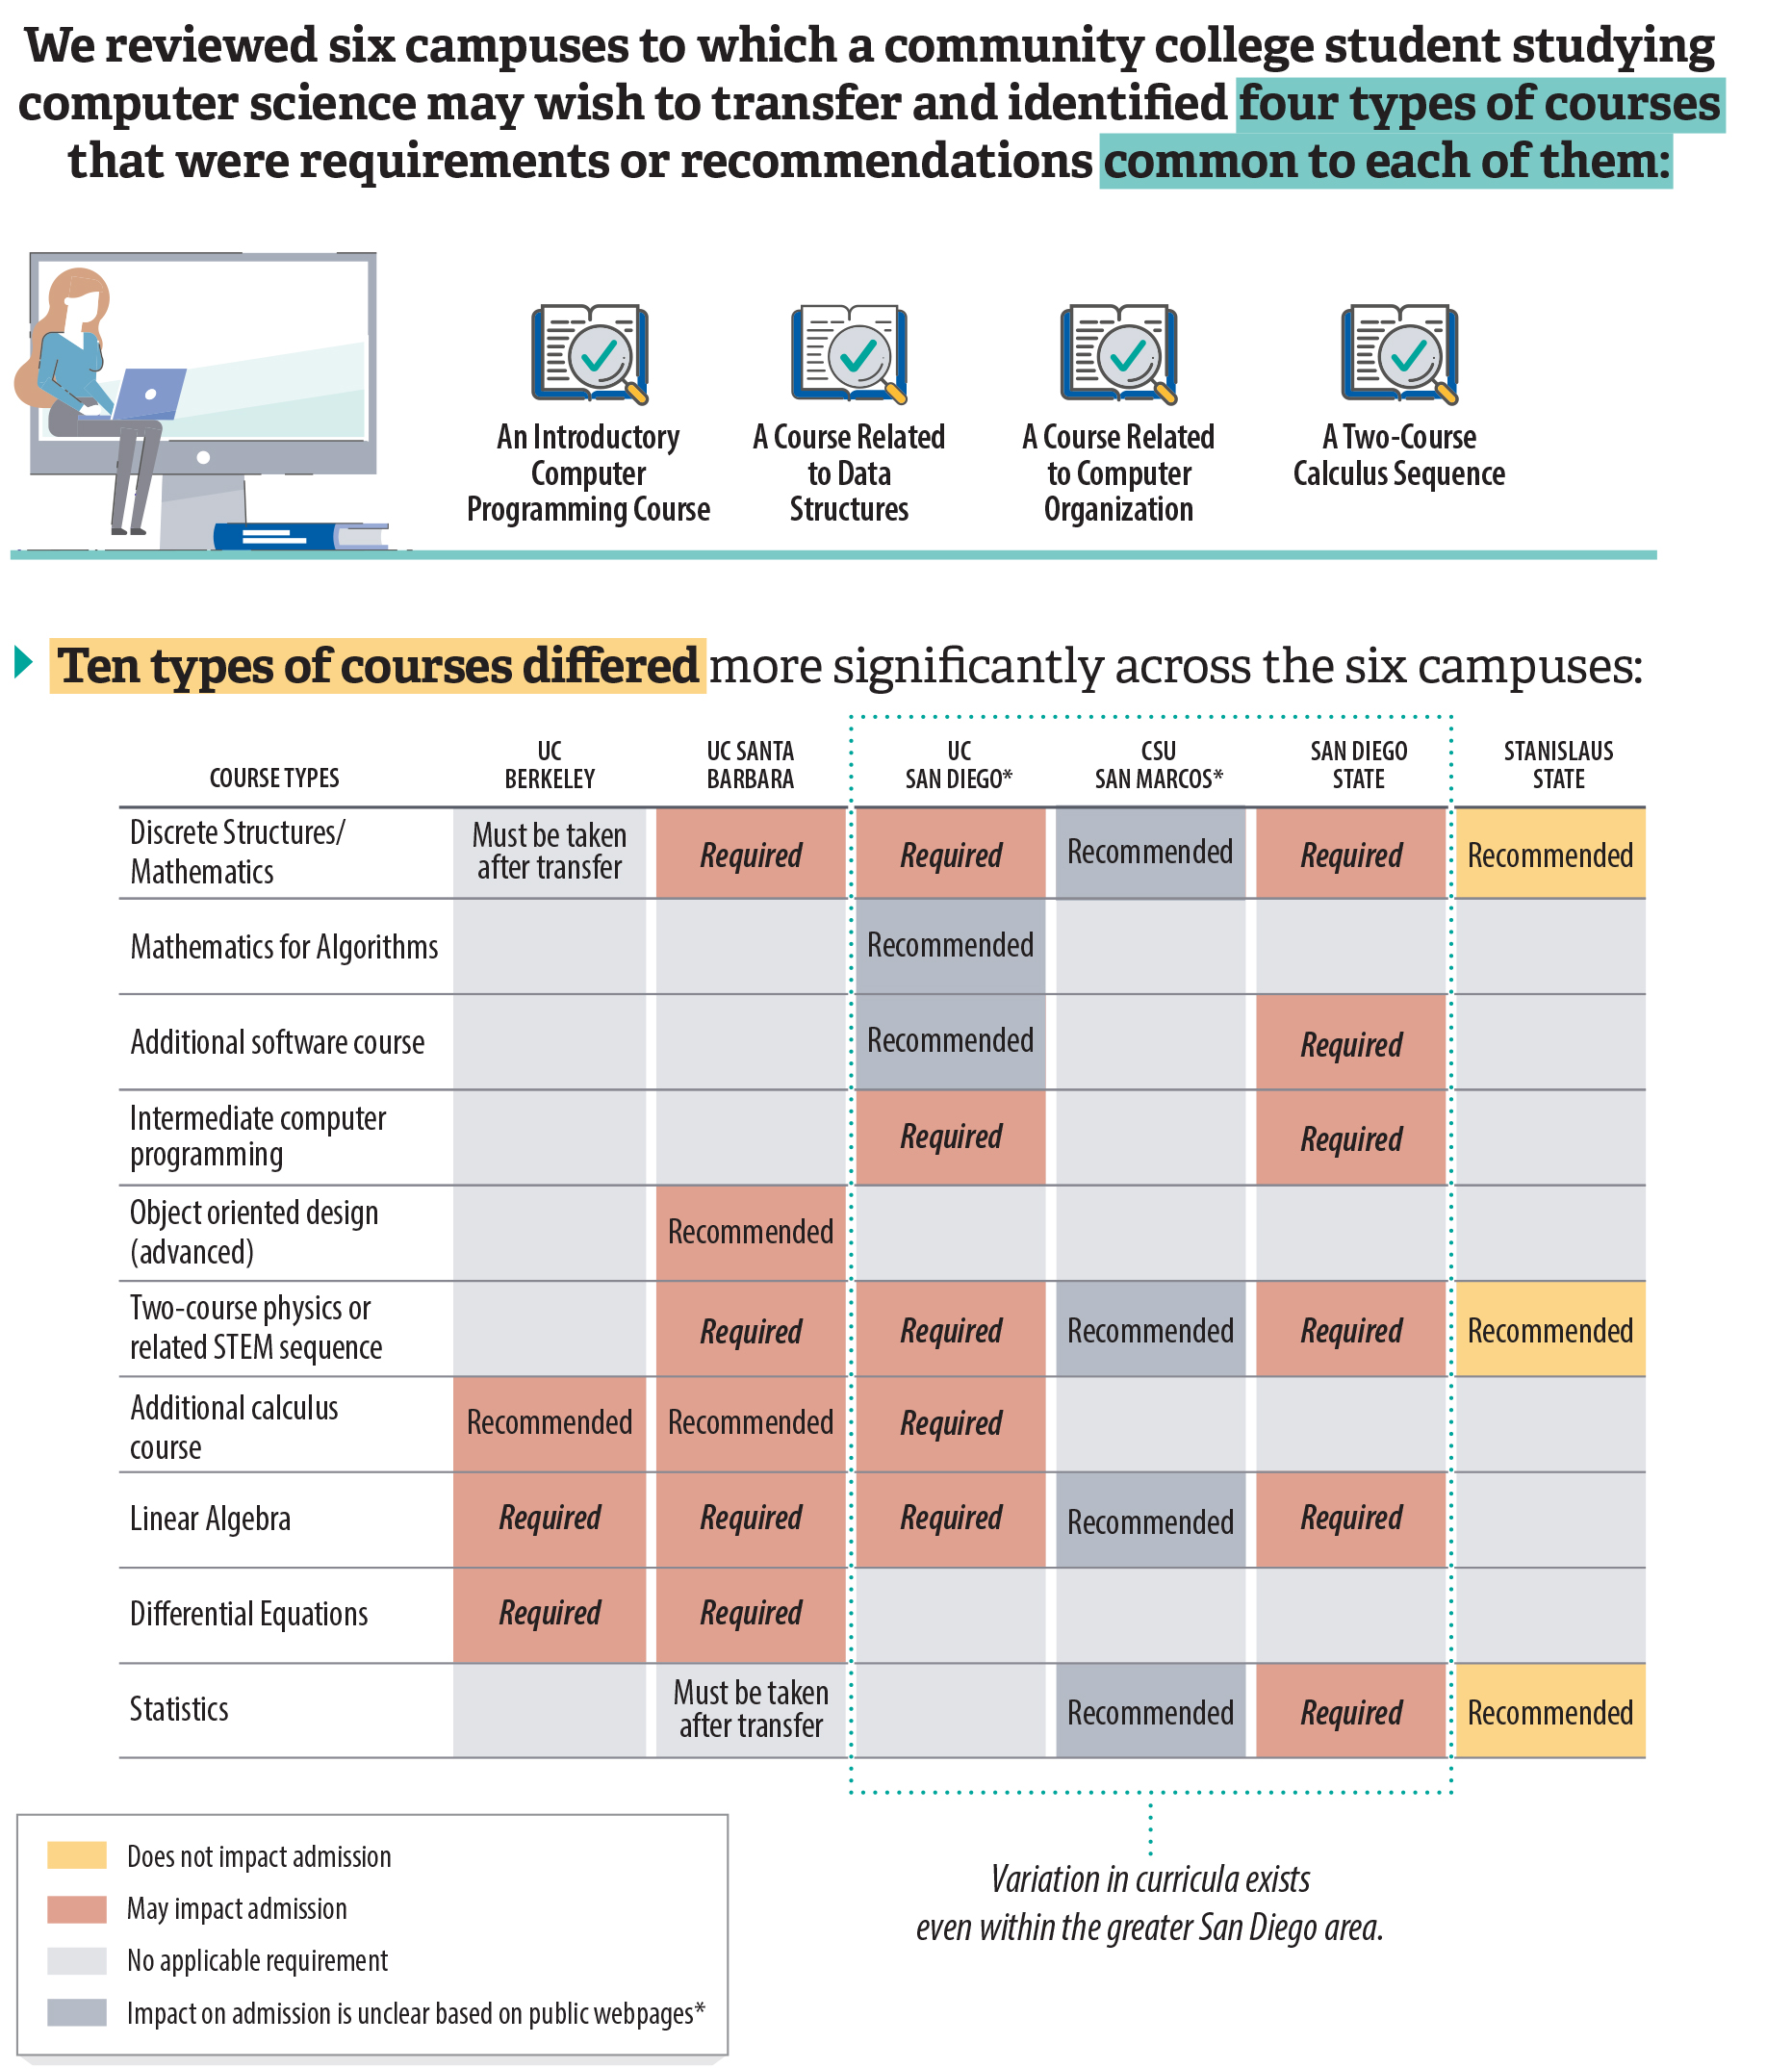
Source: Analysis of academic year 2022–23 course articulation agreements from ASSIST and campuses’ catalogs, websites, and admissions manuals.
Note: Recommended courses can differ in their impact on campuses’ admissions decisions, adding further complexity for students. For example, none of the recommended courses for Stanislaus State impact a student’s ability to gain admission, although taking them would reduce the number of courses students need to take after they transfer. By contrast, completion of UC Berkeley’s and UC Santa Barbara’s recommended courses may affect a student’s ability to gain admission.
* We did not audit UC San Diego or CSU San Marcos, so courses for those campuses reflect our interpretation of information available from ASSIST articulation agreements and related campus webpages. We include information from these campuses to demonstrate that differences can exist even within the same region.
Figure 15 is a table that shows that CSU and UC campuses each require different preparation courses for the computer science major. The top of the graphic explains that we reviewed six campuses to which a community college student studying computer science may wish to transfer and identified four types of courses that were common to each of them, such as an introductory computer programming course and a calculus sequence. Below these common course types, a table shows that ten types of courses differed more significantly across the six campuses we reviewed, including between three San Diego-area campuses: San Diego State, CSU San Marcos, and UC San Diego. In the table, each campus has its own column and each course type has its own row. The table notes whether a particular course is either required or recommended, and how it may impact students’ chances of admission. For example, for San Diego State, six course types are listed as required and are shaded red to indicate that not completing such courses may impact admission. However, for Stanislaus State, only three course types are included, and they are all listed as recommended and shaded yellow, which indicates that not completing such courses does not impact a student’s chances of admission. These types of differences exist between the other campuses included in the table as well.
Moreover, students face an added layer of complexity because their completion of major preparation courses may affect them differently depending on the campus to which they apply. For example, with the exception of its impacted nursing program, Stanislaus State does not consider as part of its admissions decisions any major preparation courses, meaning that students can gain admission without having completed those courses. However, students would still need to complete those courses after they transfer, which could result in those students taking longer to finish their degrees. By contrast, San Diego State generally bases admissions decisions in part on the percentage of major preparation courses that students have completed, with each completed course contributing toward that percentage. Although San Diego State does not categorically deny students who have not completed all lower‑division courses, those students’ chances for admission to competitive programs may be lower. Similarly, UC Berkeley would consider students’ applications weaker if they had not completed all of the courses for computer science that we show in Figure 15, but it would not automatically disqualify them from admission. However, UC Santa Barbara would deem ineligible to that major a student’s application that lacks any of its required courses. Students may find these differences difficult to understand when they are making decisions about which courses to take at the community college level.
Faculty drive the CSU and UC campuses’ different approaches to course requirements. Because faculty are the curriculum experts, they can mandate prerequisite courses that they deem necessary for students to succeed in their programs—and these programs will naturally differ between campuses because of different faculty and campus interests. Campuses can still take a rigorous approach to imposing transfer requirements. For example, UC Santa Barbara has established a process for one of its Academic Senate committees to evaluate faculty proposals to add supplementary admission criteria in certain majors. According to the executive director of the UC Santa Barbara Academic Senate, since 2019 the committee has approved increases in the admissions criteria for the physics, mathematics, and chemistry majors.
Even after students understand the CSU and UC lower‑division course requirements, they still must determine whether their community college offers courses that meet these requirements. The process through which colleges and universities establish that a course at one institution is similar to a course at another is generally referred to as articulation. Transfer students rely on the articulation process because it is the mechanism that enables their community college courses to count toward CSU and UC transfer requirements. However, articulation can be time‑consuming because it is decentralized and requires sustained collaboration between multiple parties at different institutions. For example, establishing that a single community college course is similar enough to a CSU- or UC‑required course often requires significant coordination between the community college’s articulation officer and the officer at the relevant CSU or UC campus, as well as review by faculty at the CSU or UC campus.
Although the higher education systems developed an online resource to provide students with valuable articulation information, this resource has limitations. The Articulation System Stimulating Interinstitutional Student Transfer (ASSIST) is a website that shows prospective California transfer students how community college courses may satisfy elective, general education, and major requirements at a particular CSU or UC campus. However, some CSU campuses have not maintained up‑to‑date articulation agreements on the website, making it more difficult for students to accurately determine whether their courses will meet transfer requirements. For example, until 2023 San Diego State did not always add its current articulation agreements to ASSIST, preferring instead to use its own website to provide better integration to its course catalog and campus software. San Diego State officials indicated that many local community college counselors preferred its website because of its ease of use. In addition, although CSU and UC campuses often refer students to ASSIST to understand their transfer requirements, the campuses do not follow a standardized format when listing these requirements, such as specifying whether and how recommended courses will impact a student’s chances of admission. Finally, officials in all three systems told us that ASSIST does not receive dedicated state funding to fulfill its mission of serving California’s public colleges and universities, which limits its ability to maintain and expand data storage and management, make improvements to the system to benefit students, and respond to legislative mandates.
In some cases, students may learn that their community college does not offer all of the courses that a CSU or UC campus has approved to fulfill its requirement. For example, none of our five selected community colleges had full articulation with San Diego State’s mechanical engineering major or with UC Berkeley’s computer science major. As we explain earlier, if students do not fulfill certain transfer requirements, they may be less competitive for admission or may need to take additional courses once they transfer. If a community college does not offer a course that articulates to a CSU or UC requirement, students striving to be competitive for admission may have to take the needed course at a different community college. However, doing so may add cost and complexity to their education. Moreover, in some instances, a campus may not accept a student’s courses as sufficient for admission if the student has a split series, meaning that they completed some of the course sequence at one community college and other courses at a different college. Community college counselors told us that challenges with articulation—such as not being able to locate an updated articulation agreement, or learning that a needed course is not offered or articulated—can sometimes discourage students from applying to a CSU or UC campus altogether.
Although data limitations with ASSIST made it difficult for us to identify and evaluate articulation gaps statewide, ASSIST administrators have been working to develop a standardized data format that they expect to become available before the end of 2024. This format will likely make it possible to identify where the most significant gaps in articulation exist for transfer students across the State. Performing such an analysis could help the three systems prioritize their efforts to articulate the courses that will most benefit transfer students.
Although the ADT Has Streamlined Transfers to CSU for Certain Students, Changes Would Broaden Its Impact
As we discuss in the Introduction, one of the intended purposes of the ADT is to serve as the primary transfer pathway between CCC and campuses in the CSU system, and the Legislature recently established a pilot program that will expand the ADT to certain campuses and majors within the UC system. Since the Legislature authorized it in 2011, the ADT has streamlined the process for some students who transfer to CSU. However, several factors prevent the ADT from fully achieving the objectives that the Legislature envisioned. Figure 16 summarizes the three primary benefits of the ADT and its shortcomings. In particular, the ADT has helped simplify transfer requirements and can reduce the number of units and amount of time that students need to obtain a degree. Nonetheless, relatively few transfer students actually realized the full promises of these benefits.
Figure 16
The ADT Offers Significant Benefits for Students, but Drawbacks Remain
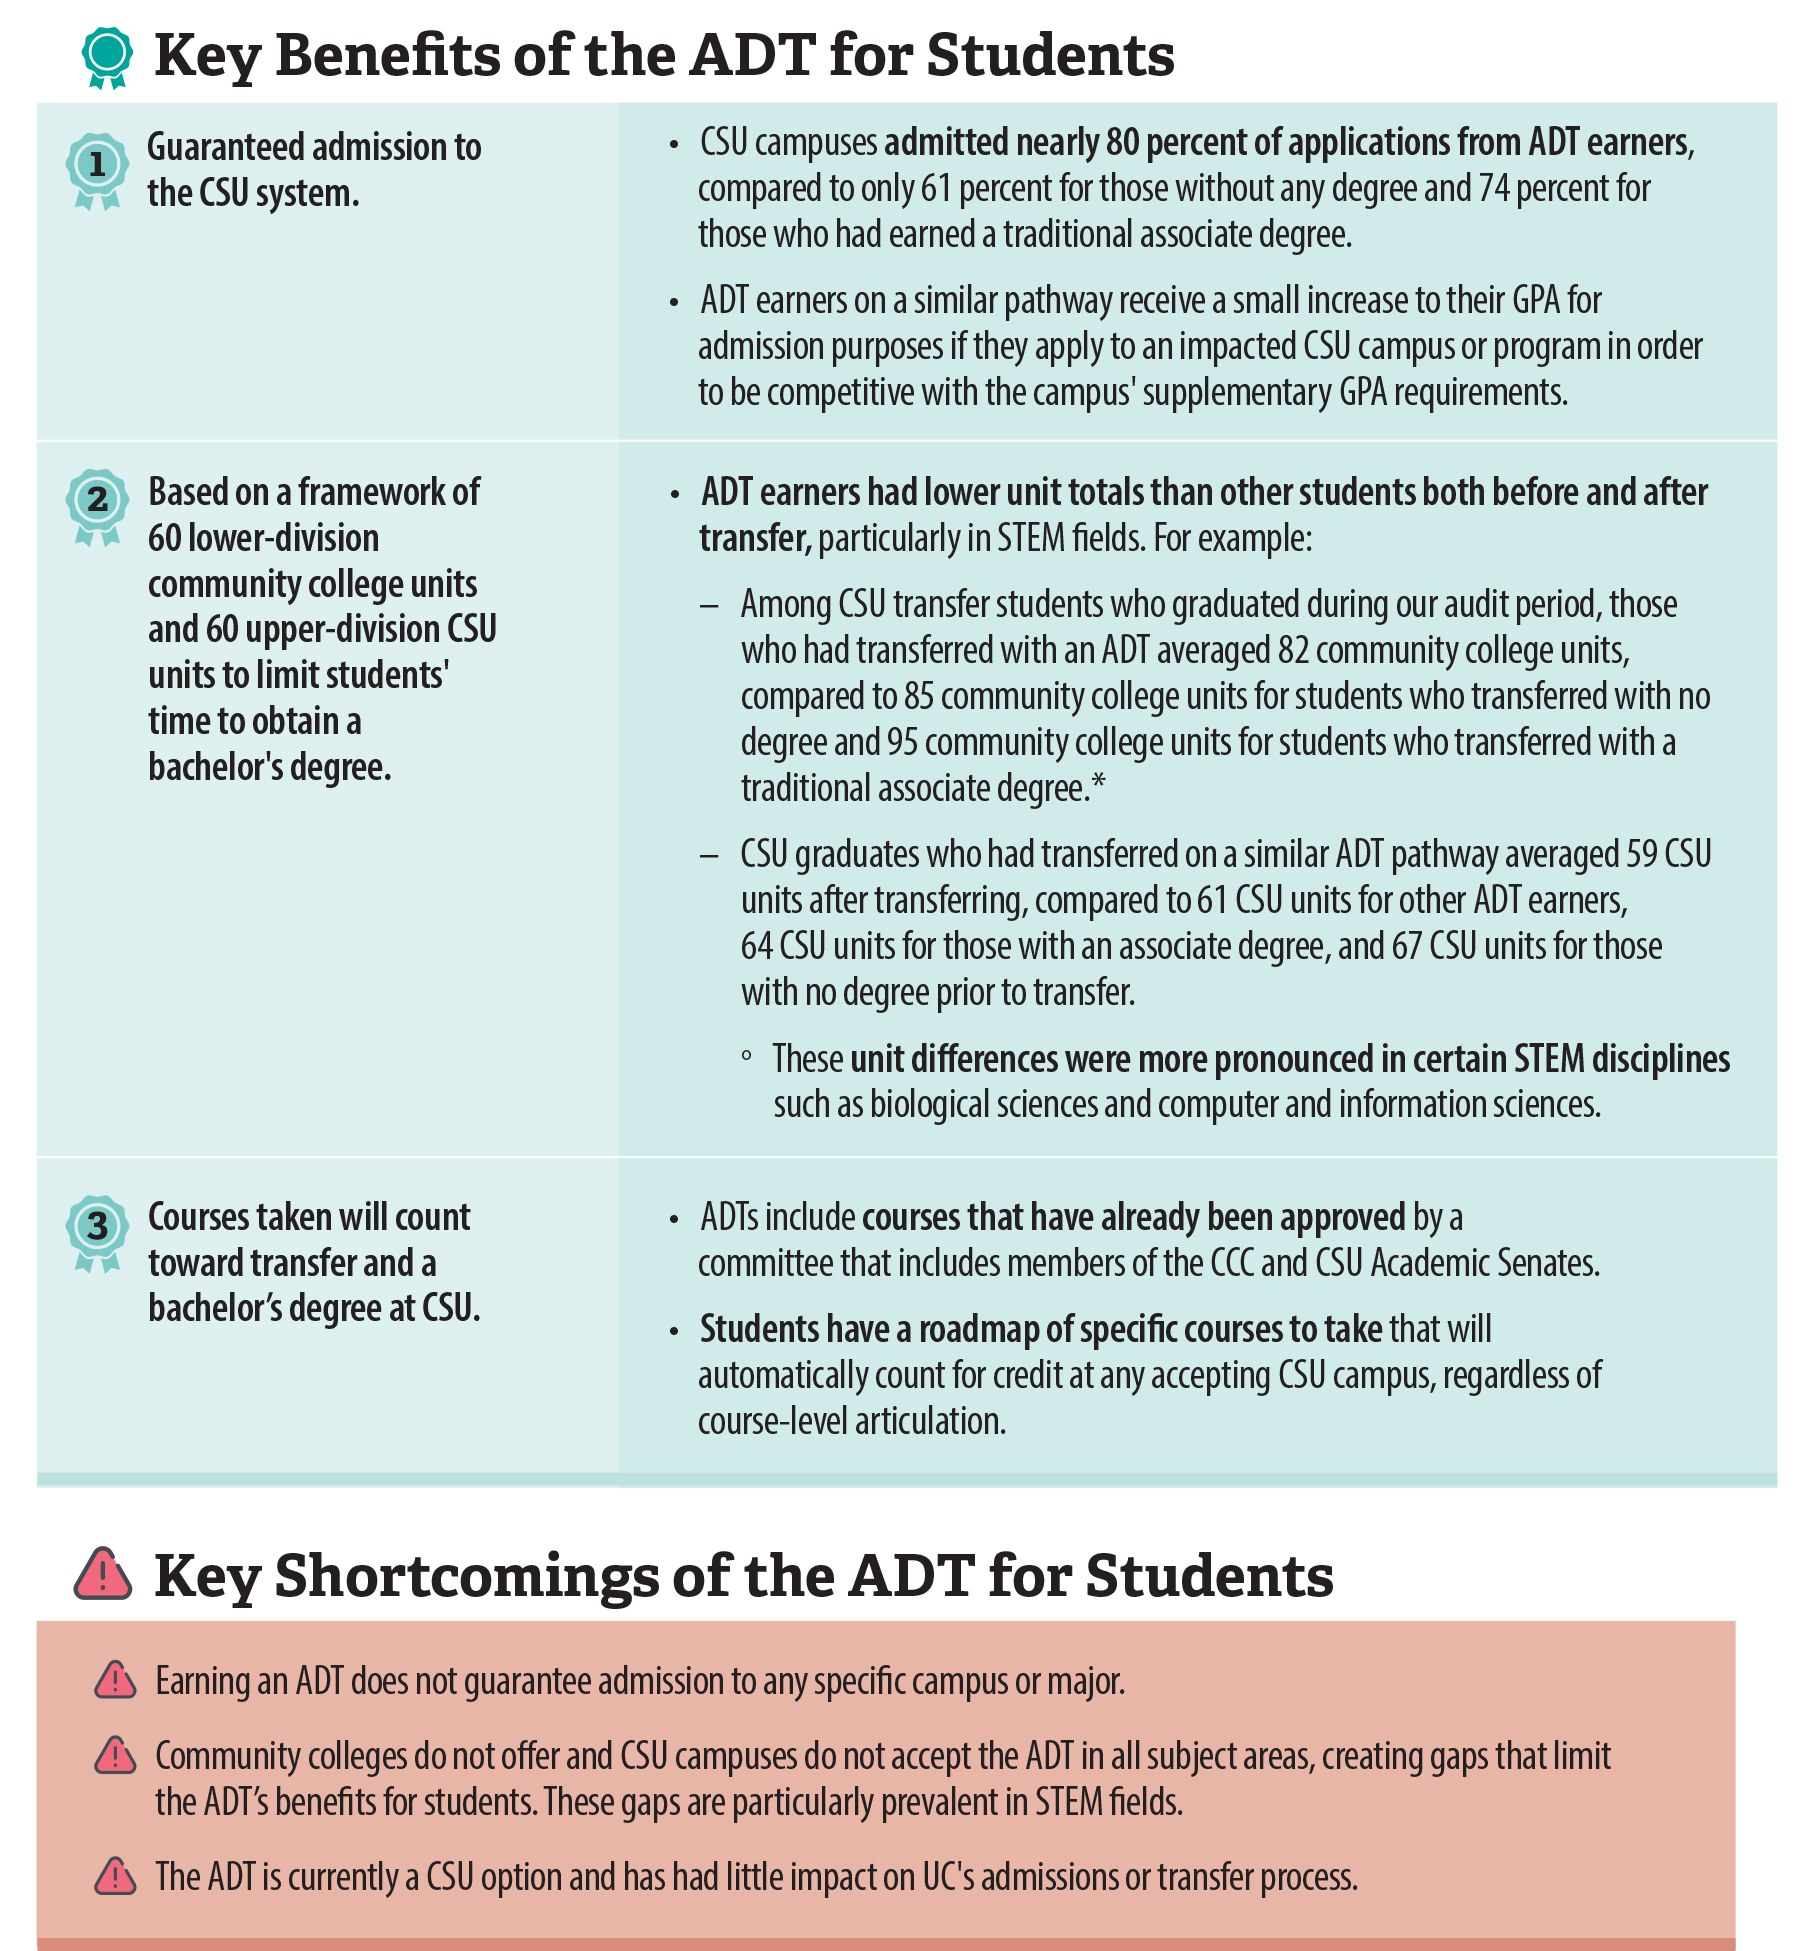
Source: State law, CSU policy, analysis of CSU public ADT data and its internal graduation data, and public research reports.
Note: Students on a similar pathway are students who have earned an ADT and transferred into a major or concentration that the CSU campus has deemed similar to the student’s ADT.
* Unit totals for ADT earners can exceed 60 units before or after they transfer if the students take courses outside of their ADT, or if they earn multiple ADTs.
Figure 16 is a detailed table in which we explain the three key benefits of the ADT for students, followed by three key shortcomings of the ADT. The table also includes examples and data that support and provide context for the three key benefits of the ADT. The three key benefits of the ADT are an admission guarantee to the CSU system, unit specifications that limit students’ time to obtain a bachelor’s degree, and assurances that courses taken will count toward transfer at CSU. The three key limitations are that the admission guarantee is not for any CSU specific campus or major, there are gaps in ADT availability across community colleges and CSU campuses, and the ADT has had little impact on UC’s admissions or transfer process.
In accordance with requirements in state law, CSU guarantees all ADT earners admission somewhere in the system, but that guarantee does not extend to a specific CSU campus or major. Further, although ADT earners still retain additional benefits over transfer students who do not earn an ADT—which we explain in the paragraphs that follow—since 2019 CSU has implemented a similar systemwide admission guarantee for all CSU‑eligible resident applicants through its redirection process, as we describe in Chapter 1.
If a CSU campus has determined that the ADT in a particular subject area is similar to one of its own fields of study—meaning that an applicant with that ADT is on a similar pathway, as we explain in the text box—then the campus, if it is impacted, provides a fractional point increase to the ADT earner’s GPA during the application scoring process.11 This advantage may be one reason that CSU transfer applicants who indicated that they had earned an ADT had an admission rate to CSU campuses that was about 5 percent higher than applicants who listed an associate degree on their application, as Table B.3 in Appendix B demonstrates. However, if the share of all CSU transfer applicants who earn an ADT continues to expand, this advantage will become less meaningful.
ADT Earners Only Receive the ADT’s Full Benefit if They Transfer to CSU on a Similar Pathway
For an ADT earner to be on a similar pathway, the following must occur:
- A CSU campus must determine that one or more of its majors or concentrations is sufficiently similar to the state-approved transfer model curriculum for the ADT in a particular subject area. This process is known as accepting the ADT.
- The student must transfer into one of the majors or concentrations for which the CSU campus accepts the ADT.
Example: A student earns an ADT in computer science and transfers into the computer science major at San Diego State, which accepts the ADT for computer science.
ADT earners who are not on a similar pathway when they transfer do not receive the full benefit of the ADT.
Source: Analysis of state law and CSU memoranda and public reports.
The ADT has also had a small but potentially meaningful impact on the number of units and amount of time that it takes students to transfer and earn a bachelor’s degree. One of the main promises of the ADT is that students can earn it within just 60 semester units at the community college level—generally equivalent to two years of full‑time enrollment—and can earn a CSU bachelor’s degree in a similar field within an additional 60 semester units of upper‑division coursework. The ADT thus enables students to earn a bachelor’s degree in four years.
Our analysis shows that students who earned an ADT and ultimately graduated from CSU did so with fewer units, both at the community college level and at CSU after they transferred, than other CSU transfer graduates did. For example, ADT earners on a similar pathway graduated with an average of 59 units at CSU, compared to 65 units for other CSU transfer graduates. When looking specifically at biological science as a discipline, the distinction between those on a similar pathway and other CSU transfer students is particularly pronounced: ADT earners on a similar pathway graduated with an average of 59 units at CSU compared to 65 units for ADT earners not on a similar pathway and to 72 units for transfer students who did not earn an ADT. Because most courses at the CSU campuses we reviewed consist of three or four units, these differences may mean that students not on a similar ADT pathway had to take multiple additional courses to earn their degrees.
Finally, the ADT has helped streamline the transfer process by creating a common framework of required courses across multiple campuses, which can reduce complexity for students. The ADT provides a preapproved package of courses that will meet transfer requirements across the different CSU campuses that accept it, minimizing the need for course‑level articulation. Specifically, for each ADT, CCC and CSU faculty from the relevant academic discipline developed a transfer model curriculum that serves as a framework of at least 18 units of required lower‑division courses toward that discipline, leaving room to complete general education courses. Each community college that decides to offer that ADT then identifies courses that meet these parameters through a statewide course identification process called the Course Identification Numbering System (C‑ID). Students who earn the community college’s ADT are therefore automatically eligible for transfer in that discipline.
Despite the ADT’s advantages, most community college students who transfer to CSU do not experience all of these benefits. As Figure 17 demonstrates, the share of CSU transfer students who earned an ADT before transferring has increased since academic year 2014–15 but was still only about half of all transfer students in academic year 2022–23. Further, only about half of those students—or one‑quarter of all CSU transfer students—were on a similar pathway, meaning that they could take advantage of all of the ADT’s benefits.
Figure 17
The ADT Has Become Increasingly Prevalent but Still Accounts for Only About Half of Transfers to CSU
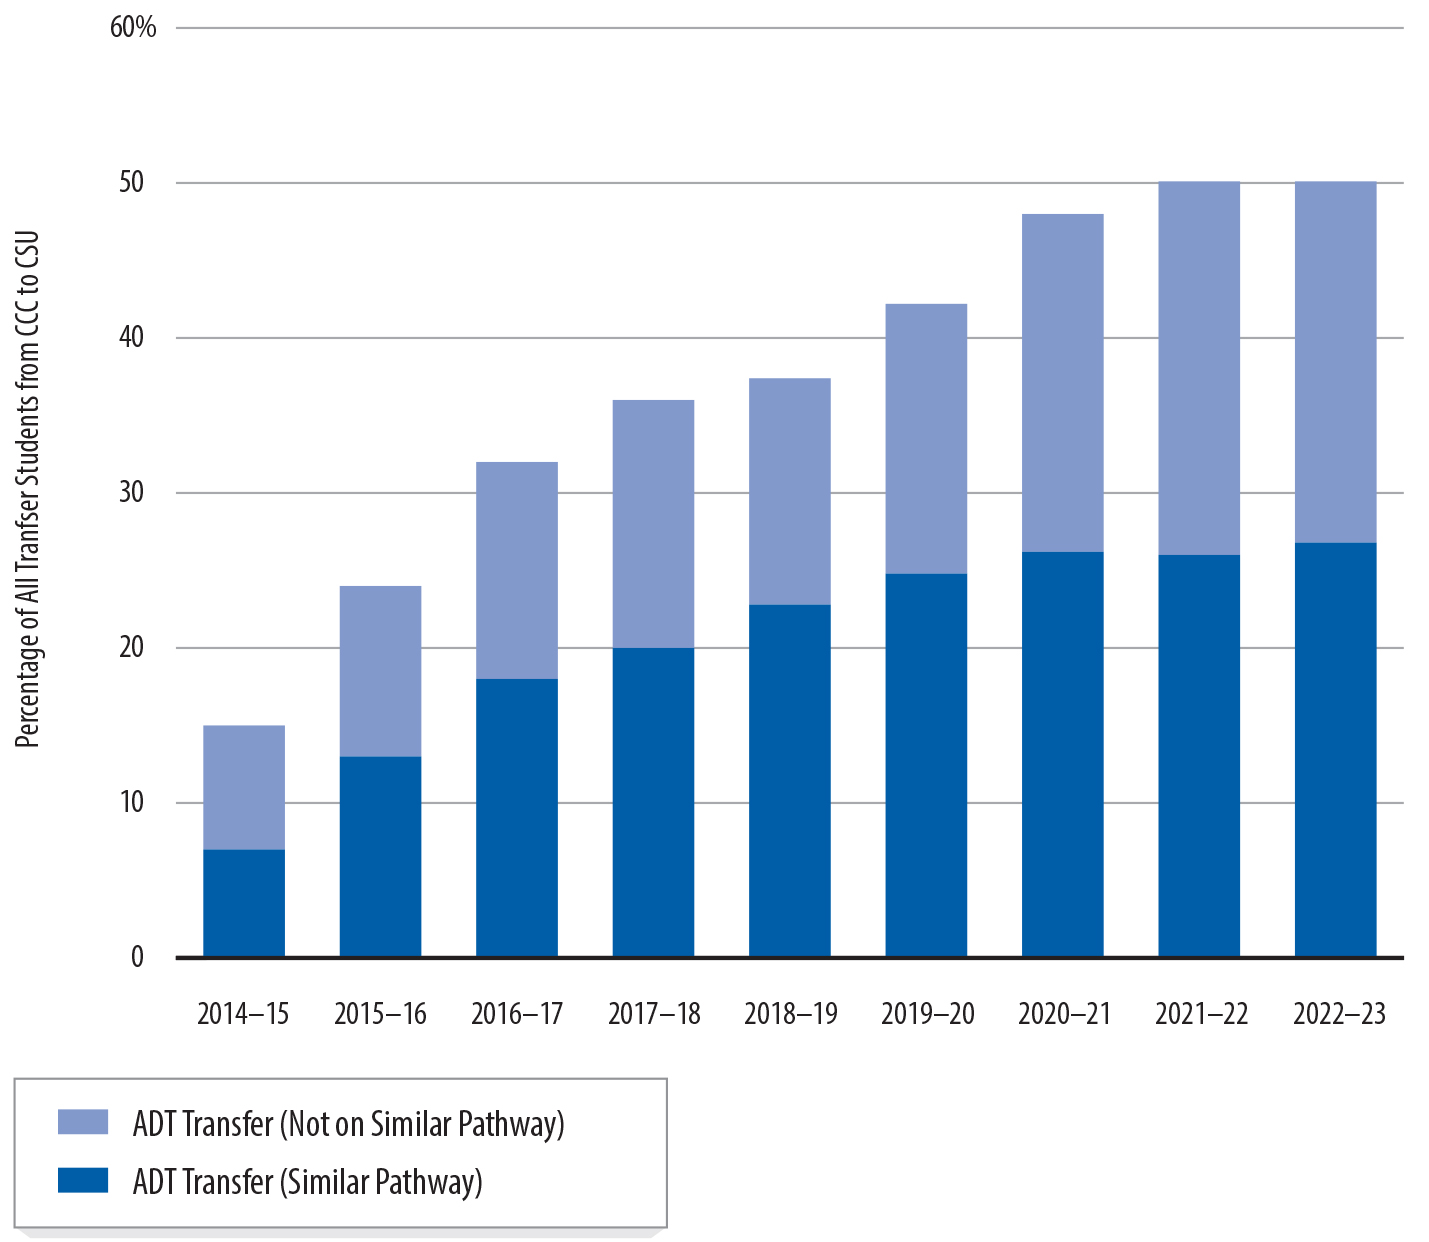
Source: Unaudited data from the CSU Chancellor’s Office and reports to its Board of Trustees.
Note: Students on a similar pathway are students who have earned an ADT and transferred into a major or concentration that the CSU campus has deemed similar to the student’s ADT.
Figure 17 is a vertical stacked bar chart that shows that the ADT has become increasingly prevalent, but still accounts for only about half of transfers from CCC to CSU. Vertical bars for each academic year from 2014-15 through 2022-23 show the rising percentage of CCC transfer students arriving at a CSU campus having earned an ADT. Each bar also distinguishes between ADT transfer students on a similar pathway, shown in dark blue, and ADT transfer students not on a similar pathway, shown in light blue. In the 2022-23 academic year, for example, about 50 percent of CCC transfer students to CSU had earned an ADT, but only a little more than 25 percent were on a similar pathway.
Transfer students may not receive the benefits of an ADT for a number of reasons. For example, they may decide not to pursue an ADT because they want to transfer into a CSU major or concentration for which no ADT exists, such as engineering. Similarly, students may earn an ADT but then apply to transfer to CSU in a different field of study, essentially forgoing the benefit of completing their bachelor’s degree within 60 units. Other students may not be aware that an ADT is a viable transfer option—a concern that a recently enacted state law may address by requiring that community colleges automatically place transfer‑intending students on an ADT pathway by August 2024, if an ADT exists for their intended major.
However, perhaps the most significant limitation to the ADT’s impact is that community colleges may not offer every ADT, and CSU campuses may not accept every ADT, as Figure 18 shows. For community colleges, offering a particular ADT means providing courses that meet the specifications of that transfer model curriculum, including the 60‑unit cap on required courses. For CSU campuses, accepting an ADT means accepting students who have earned that ADT as sufficiently prepared for one or more related majors or concentrations and providing those students the opportunity to receive a bachelor’s degree within 60 upper‑division units.
Figure 18
Community Colleges May Not Offer and CSU Campuses May Not Accept ADTs in All Fields of Study
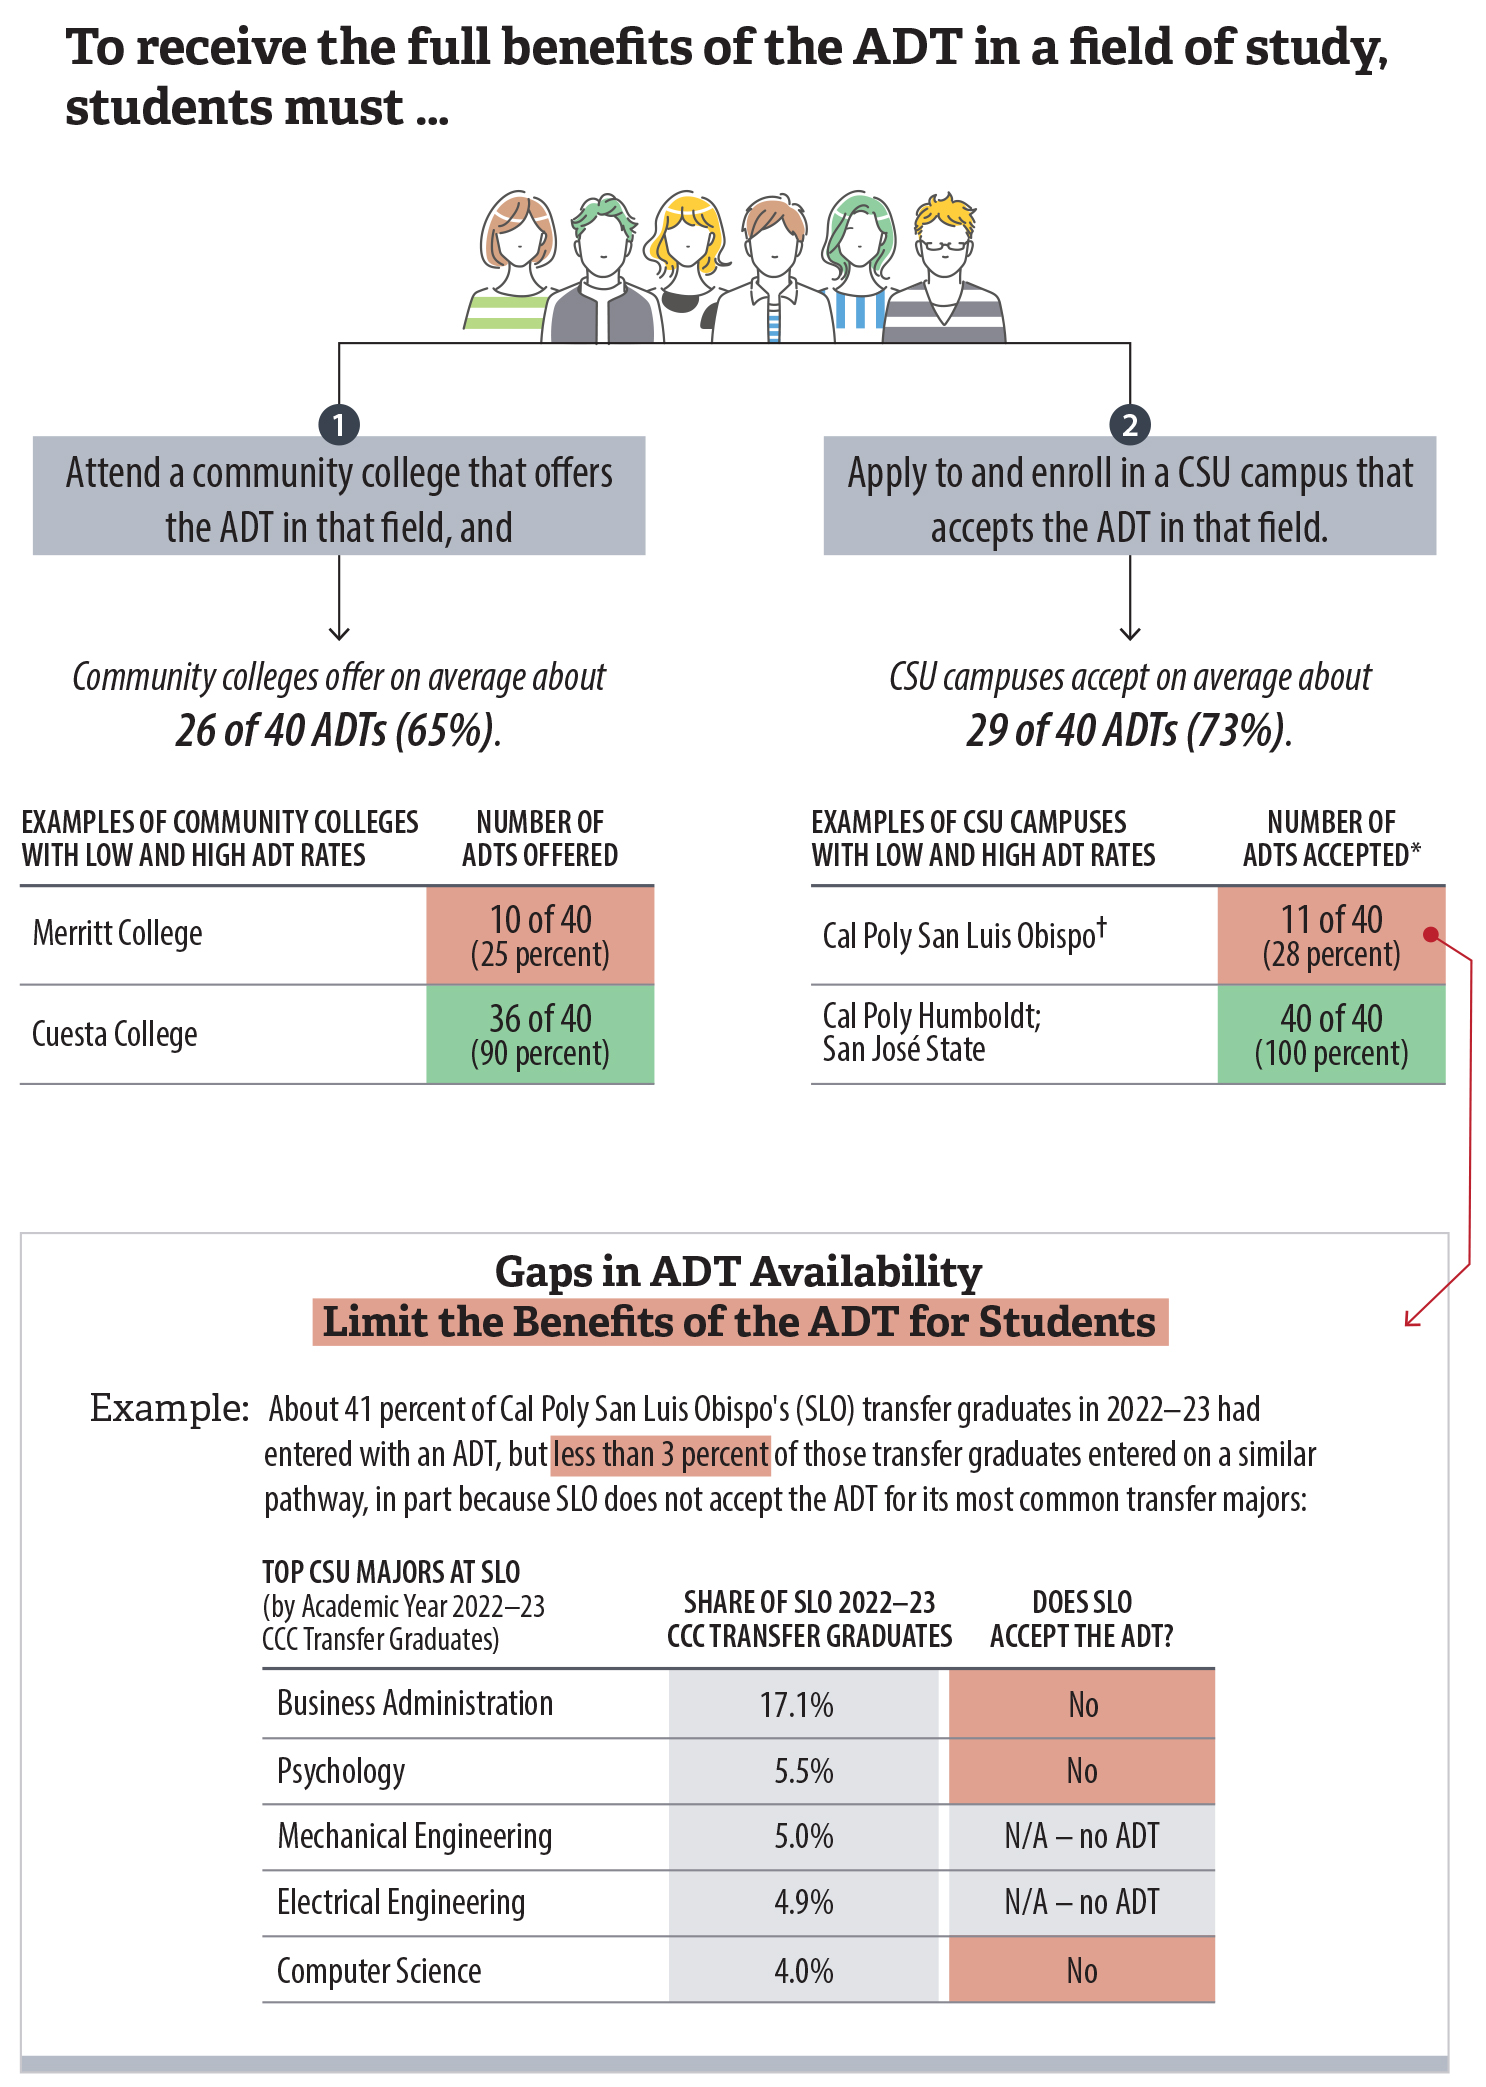
Source: Analysis of data from CSU’s public ADT and transfer model curriculum databases as of Fall 2023, and CSU data for graduates.
* Accepting the ADT means that a campus has deemed at least one of its majors or concentrations as similar to the ADT.
† Cal Maritime accepts fewer ADTs than Cal Poly San Luis Obispo does, but Cal Maritime has limited and specialized programs.
Figure 18 is a diagram showing that community colleges may not offer and CSU campuses may not accept ADTs in all fields of study, which can limit the benefits of the ADT for students. The top of the graphic shows that to receive the full benefits of the ADT, students must both attend a community college that offers and ADT in that field and enroll in a CSU campus that accepts the ADT in that field. Community colleges offer on average about 26 of 40 ADTs and CSU campuses accept on average about 29 of 40 ADTs, with significant variation across individual colleges and campuses. For example, two CSU campuses accept all 40 ADTs, but Cal Poly San Luis Obispo accepts only 11 out of 40 ADTs. The bottom of the graphic provides an example specific to Cal Poly San Luis Obispo that shows that the campus does not accept the ADT in some popular fields, such as business administration and computer science, which limits the ADT’s benefits for students.
The ADT’s prevalence is particularly limited in some STEM fields, as Figure 19 shows. As a result, fewer students in these STEM fields transfer to CSU with an ADT or on a similar ADT pathway. For example, in Fall 2022, only 32 percent of students who transferred from community colleges to CSU in the computer and information sciences discipline had earned an ADT, and only 13 percent were on a similar pathway. By contrast, about 72 percent of CSU transfer students in the psychology discipline had earned an ADT, and about 47 percent were on a similar pathway.
Figure 19
Gaps in ADT Availability Are Most Pronounced in STEM Fields
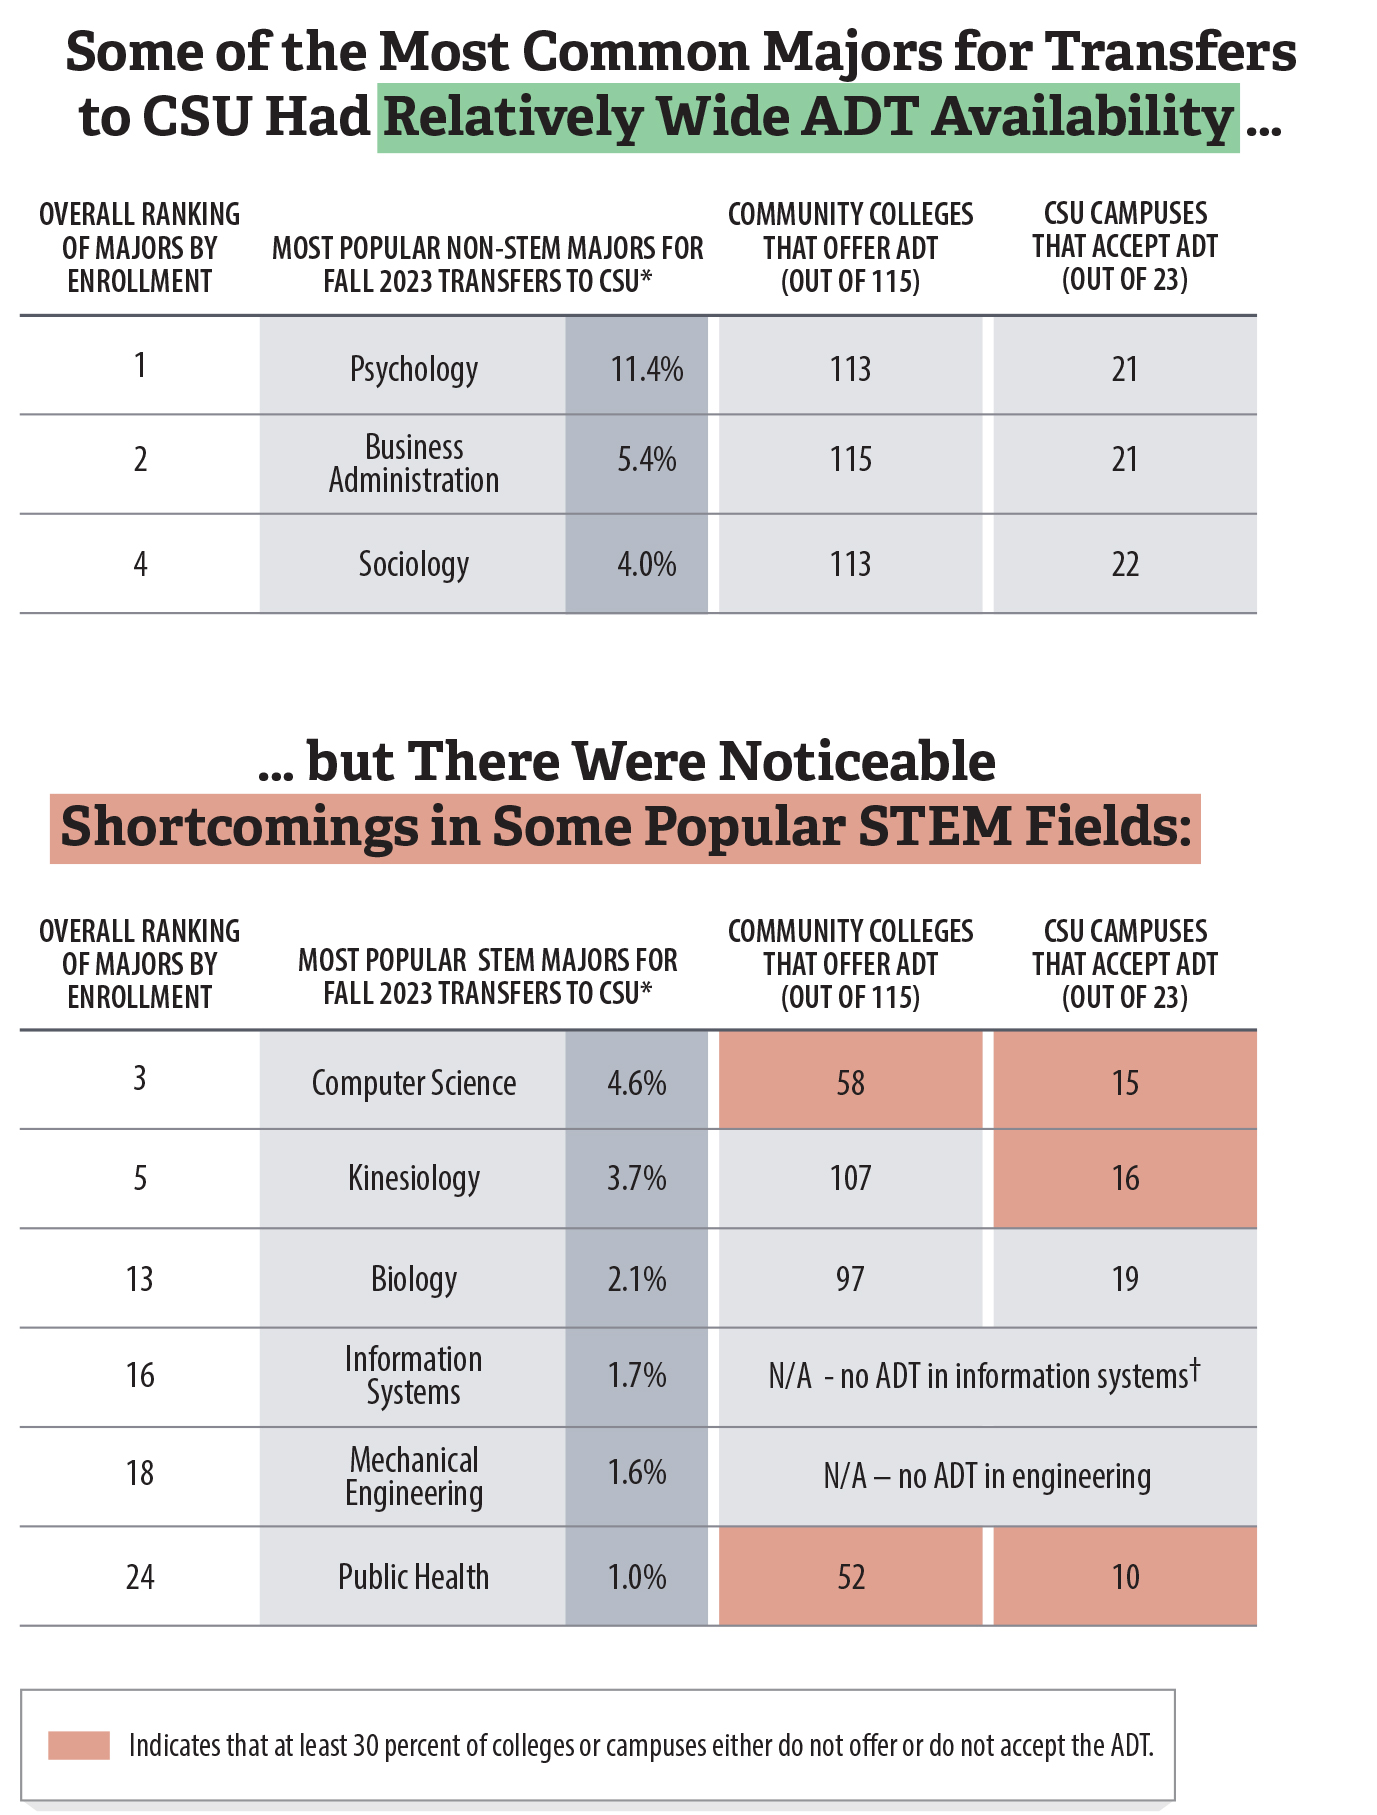
Source: Data from CSU public dashboards related to the ADT and undergraduate student origins.
* We present transfers in the most popular non‑STEM and STEM majors as a percentage of all CCC transfer enrollees to CSU in Fall 2023.
† Information systems is a standalone major and a concentration in both the computer science and business majors. Some CSU campuses have determined that the Business Administration ADT is similar to an information systems concentration within their business major.
Figure 19 consists of two tables that show that gaps in ADT availability are most pronounced in STEM fields. The first table is for non-STEM fields, and it shows that three of the most popular majors for transfer enrollment in the CSU system—psychology, business administration, and sociology—have relatively wide ADT availability across community colleges and CSU campuses, meaning that many colleges offer the ADT and many CSU campuses accept it. The second table is for STEM fields and shows some noticeable shortcomings in ADT availability. For example, computer science is the third most common major by enrollment within the CSU system, but only 58 of 115 community colleges offer an ADT in this field and 15 out of 23 CSU campuses accept the ADT. Public Health is another STEM field with similar shortcomings. By contrast, biology is an example of a STEM field with relatively wider ADT availability.
Although ADTs now exist in 40 subject areas that include most majors in which CSU’s transfer students enroll, there are notable STEM fields in which no ADT exists. For instance, no ADT exists in engineering, even though nearly 2,500 students who transferred from community college to CSU—or just about 5 percent of all transfers—enrolled in an engineering major in Fall 2022. The committees that draft transfer model curricula have continued to explore adding an ADT in engineering fields.12 However, representatives from all three systems have indicated that including all of the necessary coursework for certain STEM programs within the current 60‑unit limit is challenging, and we discuss steps taken to address this challenge later in this section. Nonetheless, because STEM majors tend to include more course requirements and units than other majors do, STEM transfer students may benefit the most from the ADT’s streamlined curriculum and unit guarantees. In general, increasing the use of the ADT in STEM fields would likely require both expanding its impact in existing fields, such as computer science, and adding it in new fields, such as in engineering majors.
Another reason that students may not transfer on a similar ADT pathway is that CSU campuses may accept an ADT as similar to only some of their relevant majors or concentrations, limiting its benefits for students who decide to enroll in other majors or concentrations. For example, 19 out of 23 CSU campuses accept the ADT in economics. However, 11 of those 19 campuses accept the economics ADT for only one major or one concentration within that major. For instance, San Diego State’s economics major contains four possible concentrations, but that campus accepts the economics ADT in only one of these. By contrast, some other CSU campuses—such as Long Beach, Los Angeles, and Pomona—accept the economics ADT for additional concentrations within the economics major, maximizing the ADT’s utility for students transferring to those campuses. Given that the ADT framework allows it to prepare students to transfer into various types of related majors and concentrations, CSU campuses should have a clear rationale in situations when they limit its benefits.
The text box summarizes some of the reasons community college and CSU officials provided for not offering or accepting the ADT in certain fields. One significant barrier to community colleges offering ADTs in certain fields is the requirement that the ADT’s coursework not exceed 60 units. For example, Diablo Valley’s senior dean of curriculum and instruction told us that the college identified courses for the computer science ADT that totaled 61 units. She stated that faculty could not reduce the units to meet the 60‑unit limit because they believe that the 5‑unit calculus courses they developed for an associate degree in computer science provide students with the best possible academic preparation. However, she noted that another college in the same district offers the ADT in computer science with calculus courses that are only 4 units.
Key Reasons for Existing Gaps in ADT Availability
Key Reasons for Not Offering the ADT in Certain Fields
- No similar program or major exists at the college.
- The college cannot fit all of the required courses within the ADT’s 60-unit limit.
- The college does not offer all of the courses needed to develop the ADT.
- No one individual or department at the college has clear administrative responsibility for developing an ADT in a particular field.
Key Reasons for Not Accepting the ADT in Certain Fields
- No similar degree or major exists at the campus.
- The coursework required after transfer for a student to earn a particular bachelor’s degree exceeds 60 units.
- The ADT does not adequately prepare students for success in the campus’s program.
Source: CCC and CSU policy memos and interviews with officials at the CSU Chancellor’s Office, the five community colleges we reviewed, and one of the CSU campuses that we reviewed.
Citing similar concerns, a statewide committee composed of faculty, administrators, and students recommended in a December 2023 report that the Legislature should raise the unit limit for ADTs for certain STEM majors to 66 units provided that there is clear evidence of the necessity for the increase.13 Because one purpose of the ADT is to limit the units that students need to transfer, if the law is amended to increase the unit totals for certain transfer model curricula, the higher education systems would need to weigh the costs and benefits of establishing those higher‑unit ADTs. Further, the systems could target fields in which significant and widespread gaps in ADT availability exist because of challenges with the 60‑unit threshold. For instance, 58 of the 115 community colleges offer the computer science ADT, suggesting that although the 60‑unit threshold may be a barrier for that ADT, many colleges have found a way to overcome it. A specialist in the educational services and support division of the CCC Chancellor’s Office told us that when some community colleges can offer an ADT within 60 units and others cannot, it suggests that compromise may be needed within colleges rather than an increase in the unit cap statewide.
Some CSU officials asserted that the ADT may not adequately prepare transfer students for success in certain campus programs and that campuses consequently cannot award some bachelor’s degrees with only 60 additional units. For example, San Diego State does not accept the ADT in child and adolescent development even though the campus offers a bachelor’s degree in child development. According to the director of curriculum services, San Diego State’s curriculum toward this degree includes a minimum of 65 units of upper‑division credit—53 units toward the major and 12 units of other upper‑division coursework—and therefore an ADT earner would not be able to complete the degree in 60 units. However, 17 of the 23 CSU campuses do accept the child and adolescent development ADT in at least one concentration, demonstrating that designing an ADT‑compatible degree is possible.
Although some campuses may assert that the ADT is not adequate preparation for their specialized programs, the ADT is merely half of the degree—the lower‑division courses. Thus, it allows CSU campuses some flexibility to design the 60 units of upper‑division coursework to meet the particular needs of their programs or majors. In fact, some CSU campuses accept all or virtually all of the 40 existing ADT types. For instance, except for an updated version of the communication studies ADT that the campus plans to review, Stanislaus State accepts the ADT in all of the fields for which it offers a related degree.
Although the Legislature intended the ADT to be the primary transfer pathway, state law that authorized the ADT neither explicitly requires the CCC Chancellor’s Office to monitor community colleges’ decisions to offer an ADT, nor does it require the CSU Chancellor’s Office to monitor campuses’ decisions to accept ADTs, as the text box illustrates.14 According to the specialist within the educational services and support division of the CCC Chancellor’s Office, the CCC Chancellor’s Office proactively monitored individual colleges’ adherence to their statutory responsibility to create ADTs and followed up with those not in compliance until 2019. He added that the system stopped monitoring colleges’ efforts because of limited resources and because state law did not require it to do so.
The CCC and CSU Chancellors’ Offices’ Oversight of Campuses’ Decisions to Offer or Accept the ADT
The statute that established ADTs requires the following:
Community Colleges
“ … create an ADT in every major and area of emphasis offered by that college for any transfer model curriculum approved subsequent to the commencement of the 2013–14 academic year within 18 months of the approval.”
However, this law does not expressly require the CCC Chancellor’s Office to monitor this requirement, such as by evaluating colleges’ rationales for not offering an ADT.
CSU Campuses
“ … make every effort to accept the ADT in each of the concentrations.”
Similarly, this law does not require the CSU Chancellor’s Office to evaluate campuses’ rationales for not accepting an ADT.
Source: State law.
For its part, the CSU Chancellor’s Office provides minimal monitoring of campuses’ acceptance of ADTs. For example, it requires campuses to report publicly whether they accept an ADT for a given major or concentration, but it has made only limited efforts to document and evaluate campuses’ detailed rationales for changes that result in discontinuing ADT pathways. The assistant director of undergraduate transfer programs stated that the CSU Chancellor’s Office largely defers to campuses to make decisions about their programmatic curriculum, including how it relates to similarity with the ADT. Finally, the CSU Chancellor’s Office tracks and reports publicly whether students transferred to CSU with an ADT and whether they were on a similar pathway. However, the data it displays do not distinguish between ADT earners who were not on a similar pathway because the campus to which they transferred did not accept their ADT and ADT earners who simply decided to pursue a different field of study.
Strengthening system oversight of community colleges’ decisions to offer ADTs and CSU campuses’ decisions to accept them would provide more assurance that both CCC and CSU are doing everything they can to help students transfer and graduate successfully.
UC Has Transfer Options That Are Comparable to the ADT, but They Lack Some of Its Key Benefits
UC has three transfer options that are in some ways comparable to the ADT, but they are not designed to provide the same level of benefits that the ADT can provide, as Figure 20 demonstrates. UC’s primary transfer options are the Transfer Admission Guarantee (TAG), which guarantees admission to a specific campus and major, and UC Transfer Pathways, which outlines courses that will make transfer students competitive for admission into certain majors at any participating UC campus. A student who applies for a TAG and completes Transfer Pathway courses would be using what UC refers to as Pathways+, which it considers a third transfer option and which provides transfer students the benefits from both TAG and Transfer Pathways. Although each of these transfer options offers different features, all three lack some of the most important advantages of the ADT.
Figure 20
UC’s Transfer Options Approximate the ADT’s Key Benefits but Are Not as Successful in Streamlining Transfer
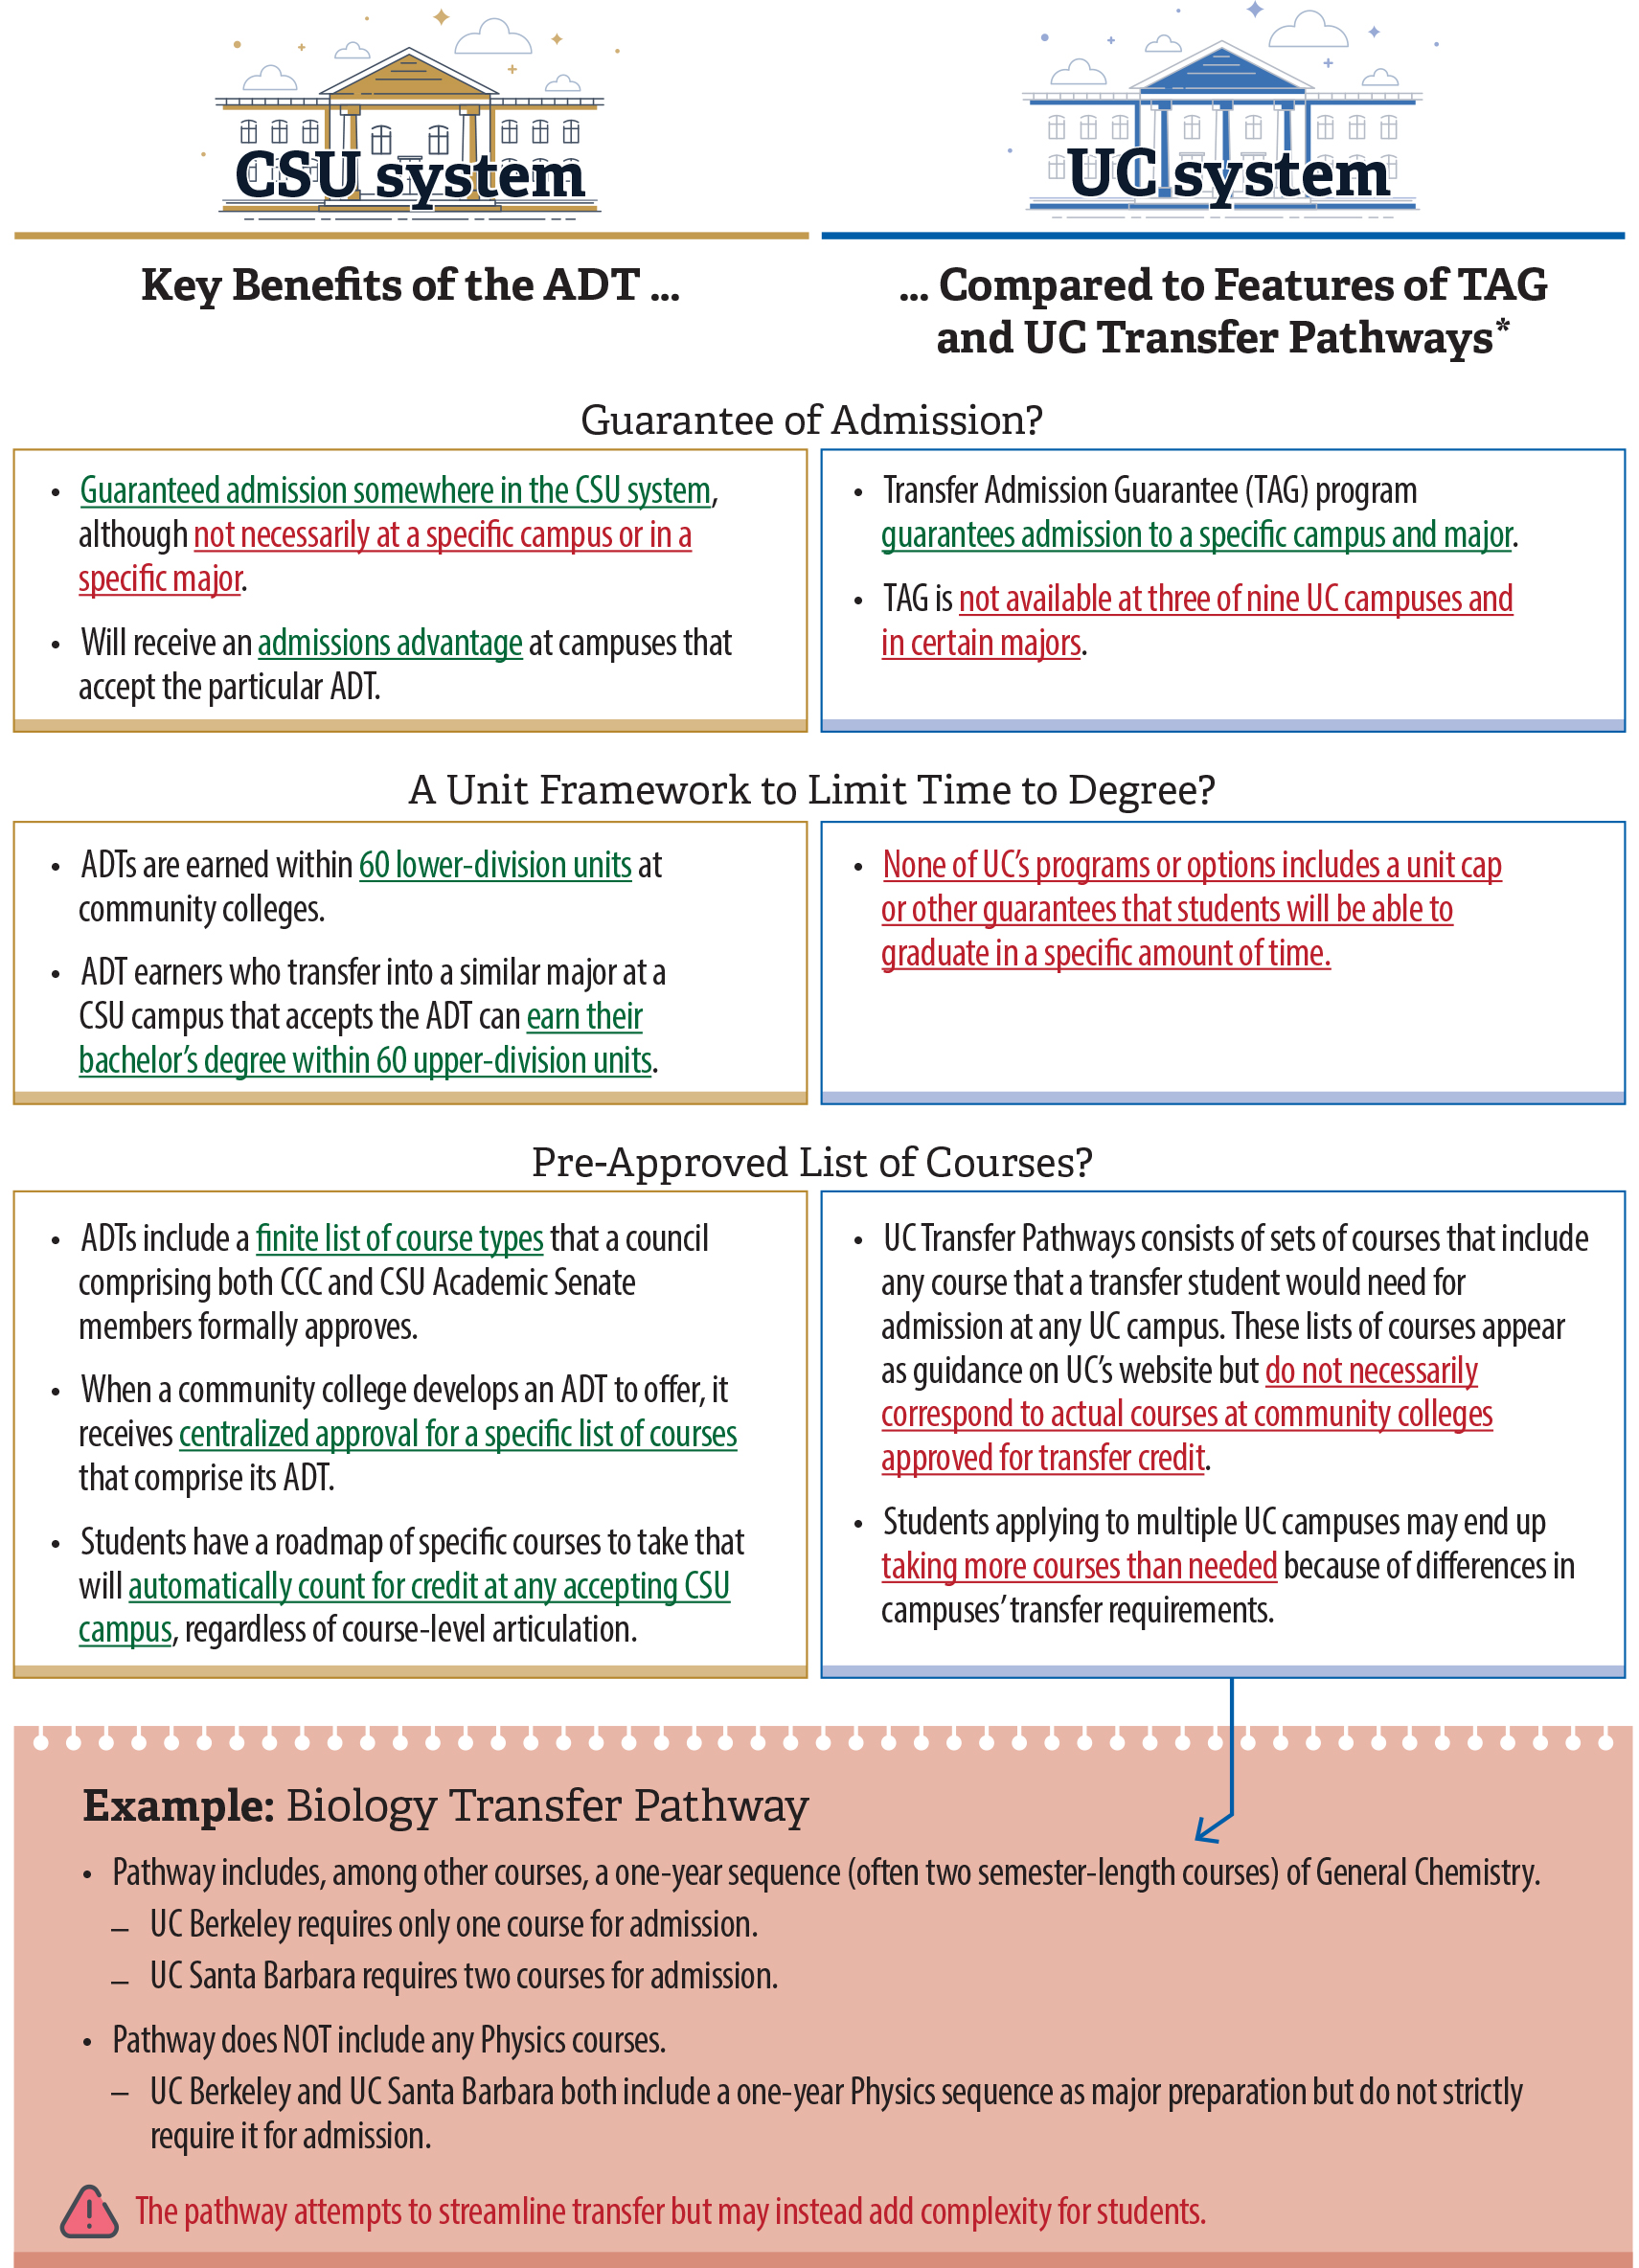
Source: Analysis of state law, UC Transfer Pathways and TAG information, and campus and system admissions requirements.
* We did not include Pathways+, which is simply a combination of UC Transfer Pathways and TAG.
Figure 20 is a chart that compares the three key benefits of the ADT to features of UC’s transfer options—most notably, TAG and UC Transfer Pathways—to show that UC’s options are not as successful in streamlining transfer as the ADT is. The three categories for comparison between the ADT and UC’s options relate to admissions, unit frameworks, and course approval. For example, the ADT contains a finite list of centrally-approved courses that will automatically count for credit at any accepting CSU campus, whereas UC Transfer Pathways courses do not necessarily correspond to actual courses at community colleges that have been approved for transfer credit. Furthermore, students applying to multiple UC campuses may end up taking more courses than needed because of differences in campuses’ transfer requirements. The bottom of the graphic contains an example from the UC Transfer Pathway in biology, showing instances in which the courses that campuses require may differ from those listed on the UC Transfer Pathway—potentially adding complexity for students.
TAG Guarantees Admission to Certain Campuses and Majors, but It Is Not a Comprehensive Transfer Option
TAG provides community college students guaranteed admission to a participating UC campus and major if those students earn a specific GPA and meet existing campus and major admission requirements. Whereas the ADT’s admission guarantee is for the CSU system as a whole, TAG guarantees admission to a specific UC campus and major, which provides more predictability for transfer applicants. TAG is relatively popular among transfer students: according to data from a CCC‑UC Transfer Task Force report issued in July 2022, 30 percent of the students who applied to transfer to UC from 2018 through 2021 had a TAG.
However, TAG is not a comprehensive transfer option. Students may apply for and secure a TAG from only one UC campus. Further, as the text box shows, three campuses and certain majors at the other six campuses do not offer TAG. One of the main reasons that the three campuses do not offer TAG is that they are concerned about their capacity to accommodate the number of students who would use it. For example, the assistant vice chancellor and director of undergraduate admissions at UC Berkeley told us that the campus is not able to offer TAG because it likely could not set a GPA requirement high enough to reasonably limit the number of students who would use it.
Several UC Campuses and Majors Do Not Offer TAG
Campuses that do not offer TAG:
- UC Berkeley
- UCLA
- UC San Diego
Examples of majors that some TAG-participating campuses exclude from the guarantee:
- Computer science (Davis, Irvine, Santa Barbara, and Santa Cruz)
- Mechanical Engineering (Santa Barbara)
- Business Administration (Irvine)
- Dance (Irvine and Santa Barbara)
- Music (Irvine and Santa Barbara)
Source: UC TAG webpages.
Likely in part because some campuses and majors do not offer TAG, many students who apply for a TAG do not ultimately use it for its admission guarantee. For example, a student may apply for a TAG in computer science at UC Merced. However, the student who obtains that TAG in computer science at UC Merced is not precluded from applying to any of the other eight UC campuses. In other words, many transfer students may secure a TAG as a back‑up option rather than as a direct route to their preferred option. In fact, according to a UC report from 2021, more than 80 percent of TAG applicants ultimately enrolled somewhere in the UC system, but only about 40 percent of those applicants enrolled at their TAG campus.
Another shortcoming of TAG is its somewhat uneven use among different community colleges and demographic groups. The community colleges with the highest transfer rates tend to have a larger share of TAG applicants. For example, the 10 community colleges with the highest transfer rates, which represent 25 percent of all UC transfer applications, accounted for 29 percent of all TAG applications during our audit period. The use of TAG also varies among different demographic groups. For example, from academic years 2020–21 through 2022–23, Asian community college students had the highest usage of TAG, with nearly 12 percent of their transfer applications being associated with TAG, whereas only 8 percent of transfer applications submitted by Black or African American community college students were associated with TAG. The executive director of undergraduate admissions at the UC Office of the President also provided us with data, which we did not audit, that showed larger disparities in TAG use among certain demographic groups. For example, the data show that across three fall application cycles beginning in 2019, and among resident community college applicants considered eligible for admission, only about 20 percent of Black or African American applicants to UC were associated with TAG, compared to more than 36 percent of Asian applicants to UC.
Ultimately, TAG is unlikely to be able to serve as a comprehensive admission guarantee because the most competitive campuses and majors likely will not have enough capacity to guarantee admission to all eligible transfer applicants. Nonetheless, it can be a useful tool for guaranteeing admission and would be more effective if it served transfer students more equitably. In Chapter 3, we discuss some approaches that community colleges could take to ensure that students receive key information and support to help them transfer, including through equity plans that address transfer‑related disparities across demographic groups. We also discuss opportunities for data sharing that could help UC campuses conduct more targeted outreach to transfer‑intending students.
UC Transfer Pathways Functions as Admissions Guidance, but It Does Little to Streamline Transfer Requirements
Unlike TAG, UC Transfer Pathways does not serve as an admission guarantee. Rather, the goal of the program is to help students improve their chances of admission. As of August 2024, UC had published a Transfer Pathway webpage for each of the 20 most popular UC majors for transfer students. Each webpage lists the types of courses that will prepare transfer students to be competitive for admission in those majors across the UC system. However, in practice, the UC campuses we reviewed—UC Berkeley and UC Santa Barbara—did not directly use the Transfer Pathways as a factor in their admissions processes. Admissions officials at those campuses stated that their application review processes do not include a consideration about whether applicants have completed one of the Transfer Pathways. Perhaps for this reason, Table C.3 in Appendix C shows that UC applications from community college students who self‑reported completing a UC Transfer Pathway had similar admission rates to applications without that designation.
Another function of UC Transfer Pathways is to provide a single expansive set of preparatory courses for the same major systemwide. However, because the Transfer Pathways course lists encompass the needs of multiple campuses, they may include courses that some UC campuses do not require. For example, a UC systemwide special transfer committee report from mid–2023 explains that the UC Transfer Pathway for sociology identifies as preparation for transfer two introductory courses in sociology and a statistics course. Thus, students seeking to transfer to any UC campus might logically conclude that they need to take all three courses in order to obtain admission. However, the sociology programs at UC Davis, UC Irvine, UC Riverside, and UC Santa Barbara do not require any of the Transfer Pathways courses for admission.
Further, UC Transfer Pathways focuses on transfer admission requirements rather than on the lower‑division courses that would best prepare a transfer student to complete upper‑division coursework within a reasonable number of units. For example, UC Santa Barbara’s lower‑division preparation for the biology major includes a statistics course. However, this course is not part of the biology Transfer Pathway because it is not a requirement for admission—although the Transfer Pathway does mention this difference and indicates that a statistics course may be needed before graduation for some of UC’s biology majors. Similarly, both UC Santa Barbara and UC Berkeley include a yearlong physics course sequence in the preparation for a biology major, yet these courses are also not part of the official biology Transfer Pathway. In instances such as these, students may need to take the courses in question after transferring, which could add units and time to earning their degrees.
Finally, UC Transfer Pathways lacks the essential guarantees that the ADT provides related to time to graduate and course transferability. Specifically, UC has not streamlined campuses’ requirements into a limited set of lower‑division preparation courses that will prepare students to graduate in two years after transferring to a UC campus. By contrast, CSU campuses that accept the ADT for a certain major guarantee that a student can graduate within 60 units of transferring, regardless of whether the student has fulfilled all of the specific lower‑division courses that the particular campus would otherwise require. The ADT similarly helps reduce complexity for students around transferability—students earning an ADT receive 60 units of transferable credit, meaning that they would not need to determine whether every course they take articulates with every relevant CSU campus’s requirements. UC Transfer Pathways does not offer a comparable guarantee, although UC campuses may decide to prioritize articulating their Transfer Pathways courses with community colleges.
By Aligning Their Transfer Requirements, CSU and UC Could Improve the Transfer Process for Community College Students
Using the cohort data we discuss in Chapter 1, we found that about 21 percent of community college transfer applicants to either CSU or UC applied to both systems, and about 26 percent of ADT earners applied to a UC campus. In other words, about a fourth of all relevant transfer applicants were subject to requirements for both CSU and UC campuses. These data underscore the fact that many students could benefit if the systems minimized the differences between CSU and UC requirements. To that end, the CCC Academic Senate has been leading an effort in which CSU and UC have been participating to align UC Transfer Pathways with ADT course requirements to streamline the transfer process for students interested in both CSU and UC.
Nonetheless, several factors make it difficult for CSU and UC to align their transfer requirements. As we discuss in the Introduction, the Master Plan and state law have established CSU and UC as two separate systems with distinct missions. For example, these sources indicate that UC should be more selective than CSU and serve as the primary state‑supported agency for research. Even within each system, faculty at each campus have certain authority to develop that campus’s academic curriculum, and as a result, these curricula may vary significantly.
Moreover, changes that require collaboration among the three systems can be challenging. No single intersegmental oversight body exists for California’s institutions of higher education, and faculty and officials at the three systems generally agreed that the establishment of such an oversight body would be problematic. For example, the past and current presidents of the CCC Academic Senate told us that such an oversight body would remove input and control from those who have the best working knowledge of the policy and curriculum issues of each system. In addition, UC’s constitutional independence limits the Legislature’s ability to compel the system to engage in such cross‑system efforts.
In the absence of an oversight body, many of the three systems’ collaborative efforts to streamline transfer requirements—such as developing or revising ADTs and aligning CSU and UC requirements—have relied on ad hoc committees or those that lack dedicated state funding and require voluntary faculty participation. According to faculty leaders from all three systems, this lack of institutional funding has significantly delayed or impaired efforts to improve the transfer process. In fact, since the effort began in 2019, these efforts have resulted in the successful alignment of only two disciplines, as Figure 21 demonstrates.
Figure 21
The Academic Senates Have Had Little Success Aligning CSU and UC Major Requirements
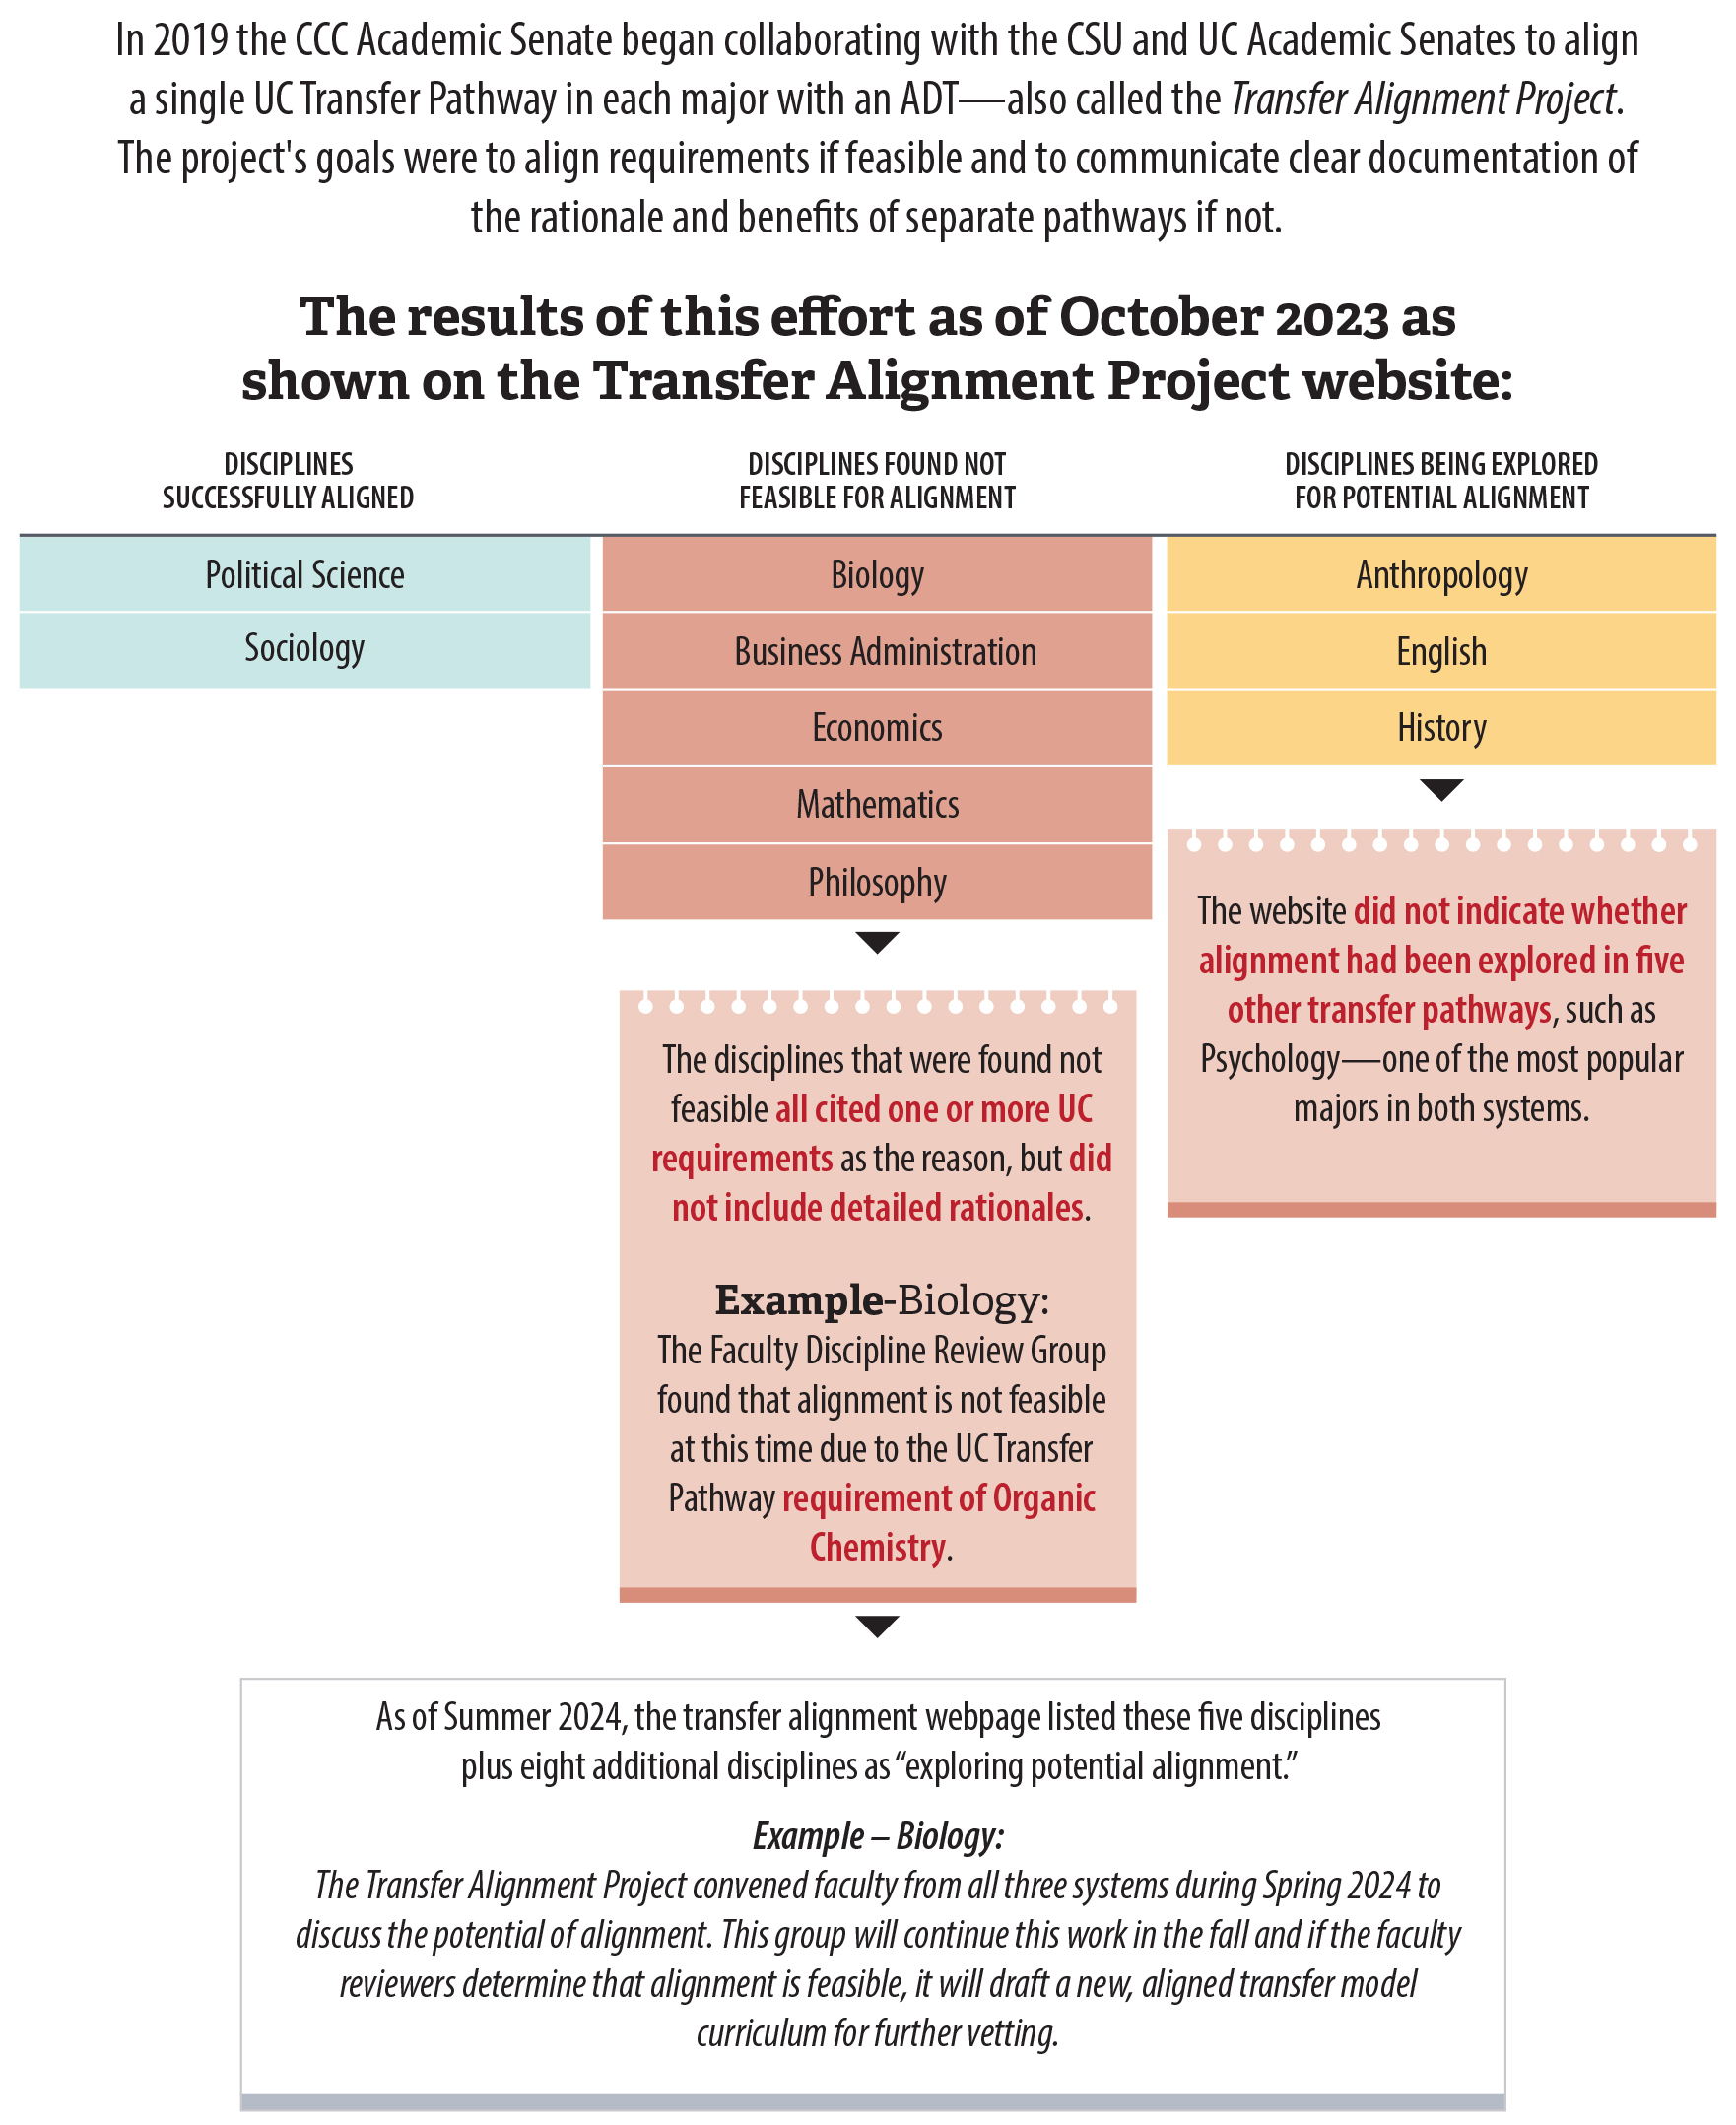
Source: C‑ID website, including pages for the Transfer Alignment Project and transfer model curricula, and the UC Transfer Pathways admissions webpages.
Figure 21 summarizes the efforts of the systems’ academic senates in aligning CSU and UC major preparation requirements, and it shows that they had little success in doing so as of October 2023. Text at the top of the graphic introduces the Transfer Alignment Project, which the CCC Academic Senate has led in collaboration with the CSU and UC Academic Senates. The project’s goals were to align major requirements if feasible and to communicate the rationale and benefits of separate pathways if not. The graphic shows that as of October 2023, only two disciplines were successfully aligned: political science and sociology. By contrast, five disciplines were found not feasible for alignment: biology, business administration, economics, mathematics, and philosophy. Three additional disciplines— anthropology, English, and history—were still being explored for potential alignment at that time. The bottom of the graphic explains that as of Summer 2024, the systems are exploring potential alignment for the five disciplines they previously found not feasible for alignment, along with eight additional disciplines.
Despite these challenges, CSU and UC and their campuses could do more to streamline requirements, especially considering that they pertain only to undergraduate education and transfer students’ lower‑division preparation before transferring. Efforts to align course requirements have continued, with added impetus from recent recommendations of the ADT Intersegmental Implementation Committee. Consisting of representatives from all three systems, this committee explicitly called for drafts of transfer model curricula that prepare students to transfer to both CSU and UC in pathways such as engineering, biology, chemistry, and computer science. The director of the Transfer Alignment Project, the main body that is working to align curricula between CSU and UC systems, believes that alignment will be most successful in mathematics and physics, with continuing work also in biology.
The text box lists options for UC to do more to align its lower‑division requirements with the ADT. The first option is for UC campuses to accept students with the ADT as sufficiently prepared for transfer if an ADT exists in that discipline. This scenario would essentially be an expansion of recent legislation, which establishes the new UC ADT pilot program. That program must begin at UCLA for at least eight majors by academic year 2026–27 and must be extended to at least 12 majors at each of five UC campuses by academic year 2028–29, with the intent that it be extended to at least 12 majors at every UC campus by academic year 2031–32. UC faculty and system officials have stated that the ADT does not always provide adequate preparation for their programs. However, the ADT framework often balances specific requirements with some flexibility at the lower‑division level. For example, the ADT in psychology has a required set of three core courses supplemented by relatively flexible categories in which students may choose from several types of relevant lower‑division courses. Further, because the ADT framework does not include any upper‑division courses, it allows for significant specialization at universities.
UC Could Do More to Align Its Lower-Division Major Prerequisites with the ADT
For a major that is not already included in the ADT pilot project, a UC campus could:
1. Agree to accept the ADT as sufficient transfer preparation.
or
2. Agree to the same types of parameters of the ADT, but for UC’s own set of courses, such as the relevant UC Transfer Pathway.
After individual campuses make good faith attempts at alignment and provide rationales to the UC Office of the President, it could allow them to opt out of both options.
Source: Analysis of state law; UC, C-ID, and Transfer Alignment Project webpages; and UC reports.
Under the second option listed in the text box, UC campuses could agree to offer the benefits of an ADT but for UC’s own set of courses, such as the UC Transfer Pathways, for majors that are not included in the ADT pilot project described earlier in this section. In other words, UC could ensure that campuses participating in this option for a particular major accept a UC Transfer Pathway as sufficient transfer preparation, and it could also ensure that the pathway limits the number of units students need before and after transfer and that the pathway courses are consistently articulated across UC campuses and community colleges. These types of benefits could potentially help further reduce the time and units it takes transfer students to earn a UC degree. For example, students who transferred to UC within four years of their initial community college enrollment averaged about 70 units of transferable credit in the cohorts we analyzed. Further, precedent exists for a UC‑sanctioned associate degree built from the UC Transfer Pathways: first offered in Fall 2019, the CCC and UC systems collaborated through a pilot program to form UC Transfer Pathways associate degrees in chemistry and physics that 23 community colleges still offer.
The systems have demonstrated that collaborating toward streamlined requirements is possible. For example, state law effective January 2022 spurred the development of a singular general education pathway that CCC students would need for transfer and admission to both CSU and UC, known as the California General Education Transfer Curriculum (Cal‑GETC), which will take effect in Fall 2025. Cal‑GETC ensures that only a single 34‑semester‑unit option exists for general education courses at the community college level, down from 37 or 39 units in prior course patterns. This change will not only simplify requirements for students at the community college level but may also allow more space for major prerequisites to fit within the ADT’s 60‑unit limit.
Individual campuses have also identified some solutions to retain curricular autonomy while still meeting transfer students’ needs. For example, UC Berkeley’s computer science program requires major preparation courses that rarely articulate with community college courses, so it has created one‑unit bridge courses for students to take after transfer that supplement their previous education with minimal impact to the time necessary to earn a bachelor’s degree. Likewise, UC Santa Barbara offers nearly two dozen courses that it designed specifically for transfer students, including bridge courses in biology, mathematics, and physics. Despite the difficulties CSU and UC face in aligning the lower‑division coursework they require, faculty in both systems can and should work together to further streamline transfer pathways and reduce complexity for transfer students.
Recommendations
Legislature
To help create transfer pathways for students in majors that require a large number of units, the Legislature should amend state law to allow certain transfer model curricula for the ADT, such as in STEM fields, to exceed the existing lower‑division 60‑unit requirement, if both the CCC and CSU systems agree. The Legislature should include conditions for this unit expansion, such as when many community colleges or CSU campuses have demonstrated an inability to fit courses within the 60‑unit requirement for that particular transfer model curriculum.
To ensure that community college students can centrally access the information they need to prepare for transfer, the Legislature should require all CSU campuses—and should request all UC campuses—to publish their existing articulation agreements and transfer requirements on ASSIST rather than only on their own external websites. Further, articulation agreements for preparation in each major should use a standardized format or common language to describe lower‑division requirements so that it is clear to students whether taking specific courses will impact their chances of admission or the time it will take them to earn a bachelor’s degree after transferring.
To ensure that CSU, UC, and CCC continue to make progress on streamlining transfer requirements for students, the Legislature should consider appropriating funding and requiring annual status reporting for the following efforts:
- Developing or revising transfer model curricula and expanding the ADT’s use.
- Aligning CSU and UC transfer requirements.
- Identifying and reducing barriers to further articulation between community college courses and CSU and UC transfer requirements.
CCC Chancellor’s Office, CSU Chancellor’s Office, and UC Office of the President
To ensure that a lack of course articulation is not a barrier to transfer, the three systems should collaborate by September 2026 to analyze articulation data and develop a plan for addressing the gaps in articulation that most negatively affect community college students. For example, the analysis could identify the articulation gaps that are most likely to reduce students’ chances of admission or to add to students’ total number of units or amount of time to transfer and earn a bachelor’s degree.
CCC Chancellor’s Office and CSU Chancellor’s Office
To help close existing gaps in the ADT’s availability and impact within their systems, the CCC Chancellor’s Office and the CSU Chancellor’s Office should each document a process by September 2025 for requesting and analyzing specific rationales from community colleges that have decided not to offer the ADT for a particular transfer model curriculum or from CSU campuses that have decided not to accept one as similar to their related majors or concentrations. These processes should also include taking the following actions:
- Review a selection of the rationales for not offering or accepting the ADT, with a focus on the areas in which it would most benefit students to have an available ADT pathway.
- Using criteria such as whether other community colleges or CSU campuses are able to offer or accept the ADT, and consulting with the systemwide academic senates or other faculty as necessary, determine whether the selected rationales are reasonable and make recommendations to the colleges or campuses as appropriate.
- To the extent their reviews identify specific challenges in offering or accepting the ADT in certain subject areas, notify the appropriate committee or group so that it may consider those challenges when revising transfer model curricula.
UC Office of the President
To streamline and simplify campuses’ lower‑division course requirements for transfer applicants in the most popular UC majors, the UC Office of the President should work with its Academic Senate and campuses to develop and begin implementing a plan by September 2026 for reviewing and updating the UC Transfer Pathways. Specifically, the plan should include the UC Office of the President taking the following actions for each UC Transfer Pathway:
- For pathways in which related ADT transfer model curricula exist, identify and publicly post which UC campuses agree to accept the ADT as sufficient coursework to be competitive for admission and to be able to earn a bachelor’s degree within a specified amount of time or units after transferring.
- For the UC campuses that do not accept the ADT as sufficient coursework, and for those pathways in which no related ADT transfer model curricula exist, update the pathway by establishing the community college courses that a student must complete before transferring to be competitive for admission and to be able to earn a bachelor’s degree within a specified amount of time or units after transferring. The Office of the President should limit the pathway to those courses that all participating campuses agree are reasonably necessary, and it should consider aligning these courses with any relevant ADT transfer model curricula.
- Regularly monitor articulation for pathway courses at participating UC campuses to ensure that the articulated pathway courses are available and consistent across community colleges.
- Require and evaluate rationales from any UC campuses that neither accept the ADT as sufficient coursework nor participate in the pathway.
Chapter 3
The Three Systems Could Better Facilitate the Transfer Process by Increasing Outreach and Support
Chapter Summary
- Community colleges play a crucial role in helping students navigate the transfer process. However, their processes for doing so have some weaknesses. For example, they have not consistently provided students with counseling and education plans that can help to ensure that the students meet transfer requirements. The CCC Chancellor’s Office could provide more specific guidance and monitoring to help improve colleges’ efforts.
- Although CSU and UC have existing programs and processes to help community college students transfer, these efforts do not reach all transfer‑intending students. Expanding and standardizing data sharing among the three systems would help improve CSU’s and UC’s outreach efforts by enabling them to better identify and support transfer‑intending students.
Although Community Colleges Serve a Critical Role in Helping Students Transfer, Their Processes for Doing So Have Weaknesses
Community colleges play a critical role in helping students navigate the complexities of the transfer process. However, we identified weaknesses in community colleges’ processes for providing information and support to potential transfer students. Figure 22 summarizes our observations. To ensure that community colleges across the State make consistent efforts to help students transfer, the CCC Chancellor’s Office should increase its guidance and oversight in these areas.
Figure 22
We Identified Weaknesses in Community Colleges’ Approaches to Creating an Effective Transfer Environment
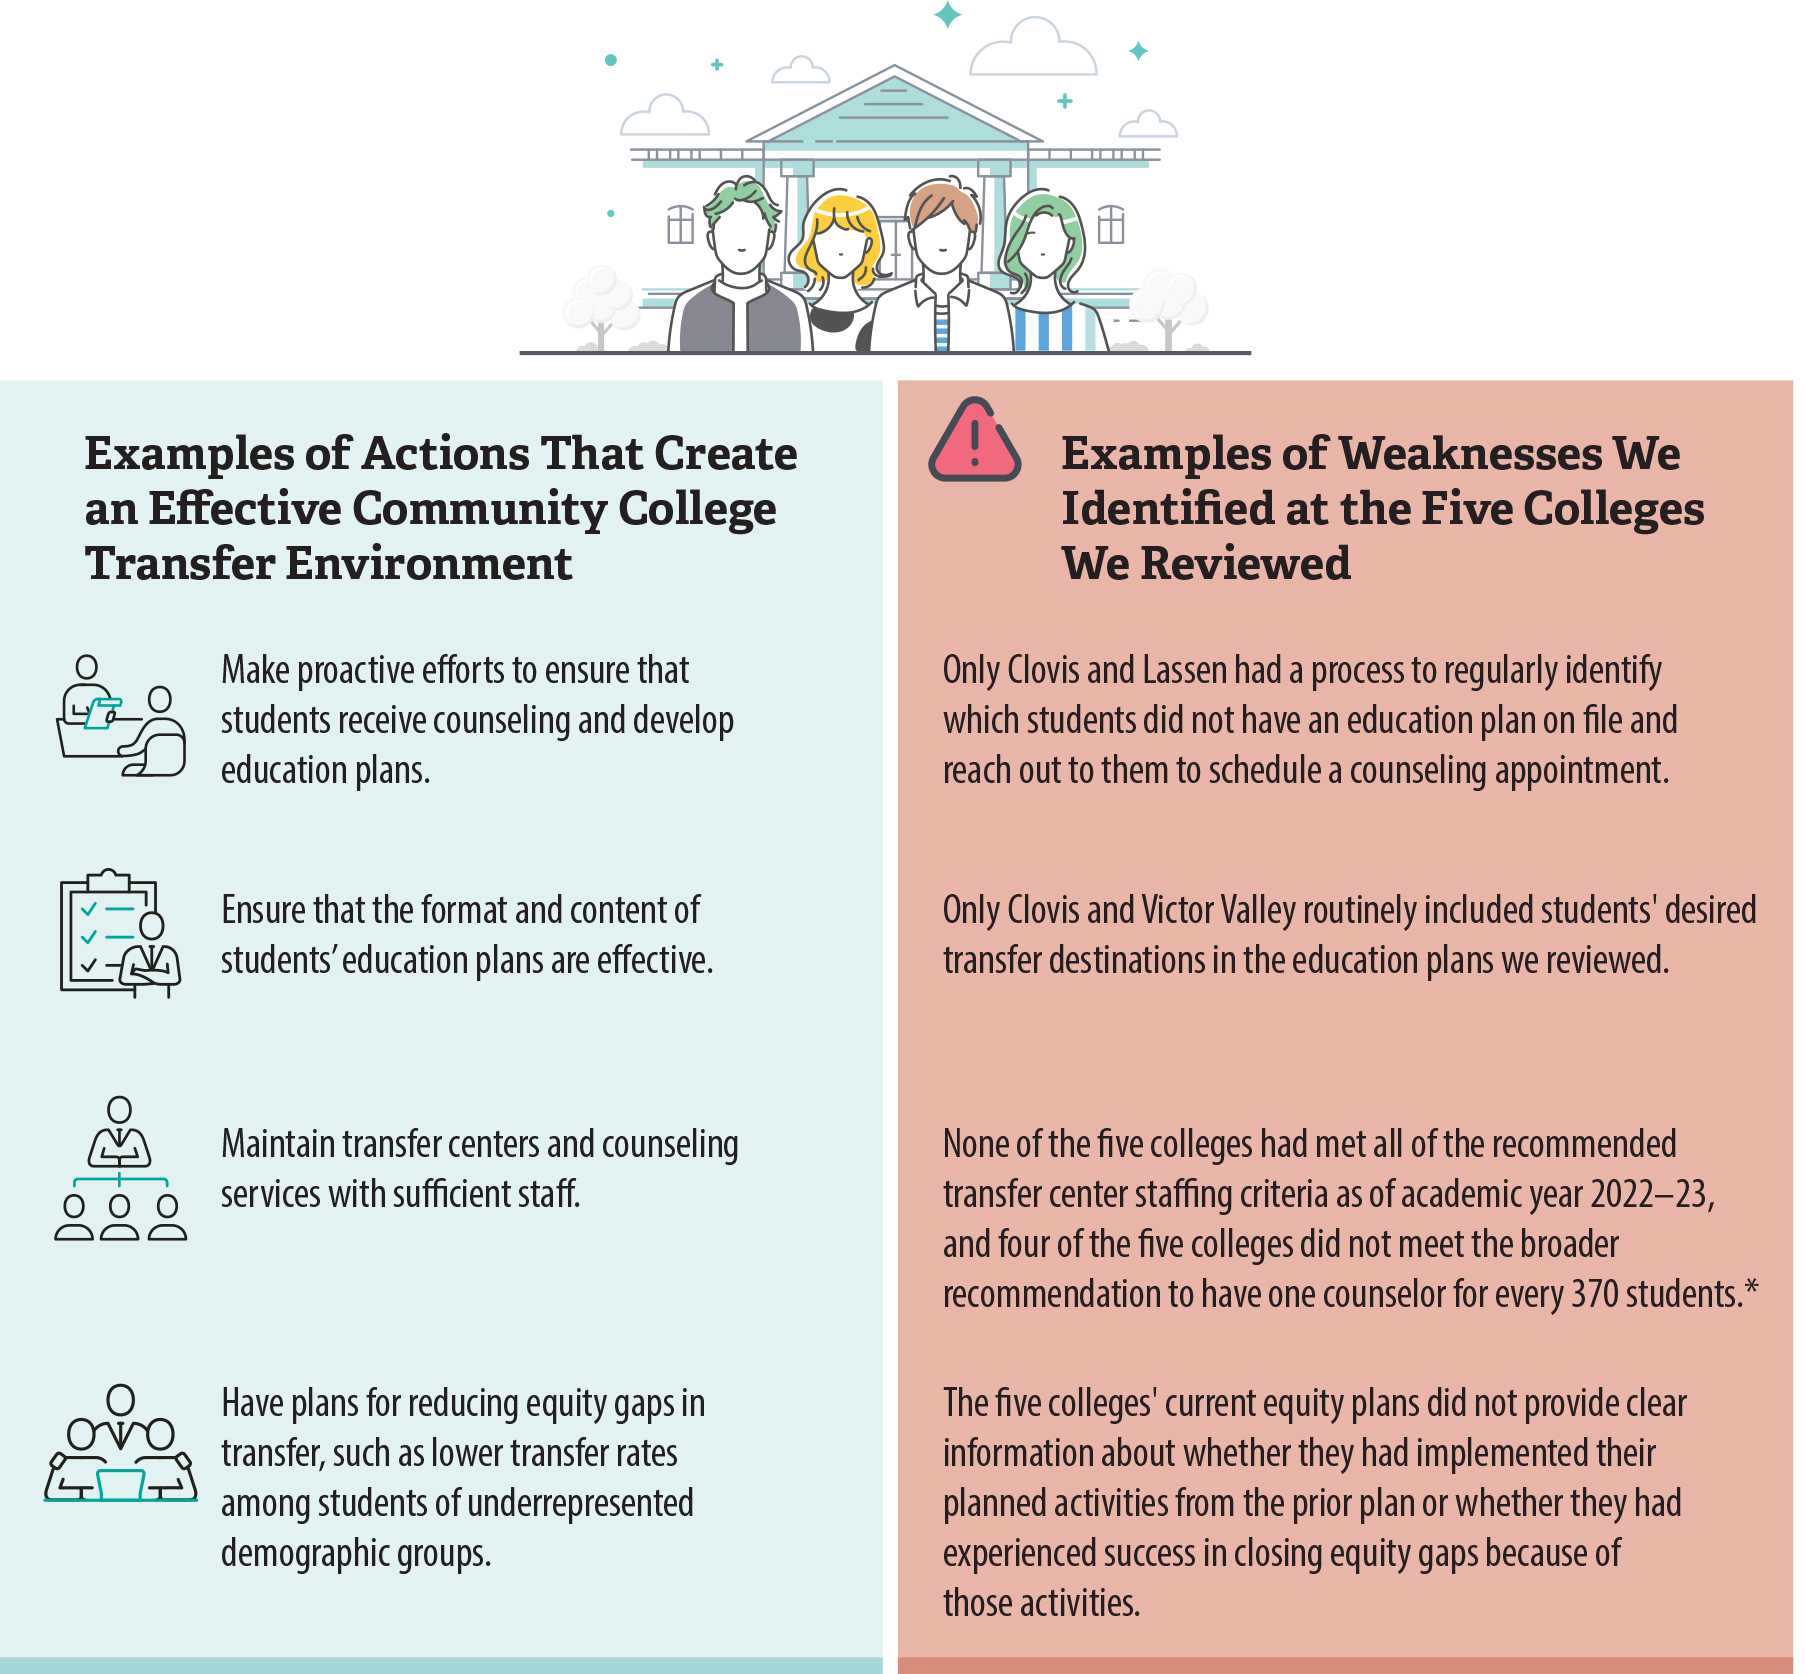
Source: Analysis of state law, regulations, public research and reports, and documents from the CCC Chancellor’s Office and selected community colleges.
* Lassen, the fifth college, met this recommended staffing level according to an ad hoc, internal calculation by the CCC Chancellor’s Office for Fall 2023. However, Lassen did not meet the recommended staffing level according to the same calculation for Fall 2022.
Figure 22 includes an overview of actions that create an effective community college transfer environment and provides examples of related weaknesses that we identified at the five colleges we reviewed. For example, community college should maintain transfer centers and counseling services with sufficient staff. However, we found that none of the five colleges had met all of the recommended transfer center staffing criteria as of academic year 2022-23, and four of the five colleges did not meet the broader recommendation to have one counselor for every 370 students.
The Community Colleges We Reviewed Have Not Consistently Provided Students With Counseling and Education Plans
Counseling and education plans are critical to colleges’ efforts to assist students in transferring—so critical, in fact, that state law generally requires community colleges to take an active approach in seeking out, counseling, and monitoring the progress of transfer‑intending students. Colleges must make reasonable efforts—especially early in a student’s time at a community college—to provide an opportunity for the student to develop an education plan, which essentially functions as a roadmap of courses that the student needs to take. Students may have abbreviated education plans to meet their short‑term needs, or they may develop longer‑term, comprehensive plans that take into account their education goals and the steps they need to take to meet them, as the text box describes. According to CCC’s Vision for Success, colleges should strive to have all students complete an education plan to help them focus on a clear path from the beginning of their college education, and that equally important is the quality and frequent updating of those education plans. Similarly, the Vision for Success indicates that it is best practice for students to receive ongoing, proactive advising. Otherwise, community colleges run the risk that some students may not receive the guidance they need.
State Law Includes Key Requirements for Student Education Plans
Districts or colleges shall provide each student with an opportunity to develop one of the two following types of education plans:
- Abbreviated education plans, which are designed to meet the immediate needs of students and are usually for one or two terms.
- Comprehensive education plans, which take into account students’ career and education goals, their majors, the institutions to which they may wish to transfer, and the steps they need to take to complete their identified courses of study.
Student education plans must be accessible, timely, and recorded in electronic form. Further, the district or college must review the plans as necessary to ensure that they continue to accurately reflect the needs and goals of the students.
Source: California Code of Regulations, title 5, section 55524.
However, only two of the five colleges we reviewed—Clovis and Lassen—had a process to regularly identify the students who had not developed education plans and contact them to schedule counseling appointments to do so. The other three colleges also took key steps to provide students with counseling and education plans, some of which we describe in the text box. However, the colleges’ efforts were not always consistent or comprehensive. For instance, as we show in the text box, Santa Ana conducted a targeted outreach process similar to Clovis’s process but completed this process only once during the period we reviewed.15
Examples of Community Colleges’ Efforts to Provide Counseling and Education Plans
Diablo Valley: It widely publicizes its counseling, education plan, and transfer center services but acknowledged that it does not have a college-wide process for identifying and reaching out to the students who have not received the services.
Clovis: Staff identify the students each semester who do not have education plans and reach out to them to schedule counseling appointments.
Lassen: Officials explained that each semester, counselors identify students who need education plans, and a staff member contacts these students to schedule appointments.
Santa Ana: In only one of the years we reviewed, staff called students who lacked education plans to ask them to connect with counselors to develop plans.
Victor Valley: Each semester, staff identify students who have completed 30 or more units and contact them to schedule counseling appointments. However, this effort is meant to provide information about graduating, and no similar process exists for contacting students who have completed fewer than 30 units.
Source: Analysis of selected colleges’ program reviews, data, and other documents, and interviews with college officials.
Furthermore, although the Vision for Success states that colleges should strive to have 100 percent of students complete an education plan, only Clovis and Lassen regularly monitored the percentage of their students who had developed education plans. For example, Clovis reported in an internal program review that 52 percent of its enrolled students in academic year 2021–22 had completed comprehensive student education plans and that a much larger percentage had completed some type of education plan. The other three colleges we reviewed did not consistently document their progress in providing students with education plans. Santa Ana performed such an analysis to show progress it had made as part of its 2021 efforts, but it did not report this type of data consistently in its program reviews or similar documents. If colleges do not monitor this type of information, they risk not understanding whether their counseling and education planning efforts have been successful in reaching all students.
Certain specialized programs that serve specific groups of students take a more hands‑on approach to providing counseling and education plan services. For example, Extended Opportunity Programs and Services (EOPS) is a program designed to encourage community colleges to establish and implement programs to help students who face certain economic, linguistic, and educational challenges. State law requires that as a condition of receiving EOPS funding, colleges must provide eligible students with three counseling or advisement contact sessions each term and must develop an education plan for each of these students. In part because EOPS and similar programs receive specific state funding, colleges may lack the resources to follow the same strategy with the general student population, but the colleges can strive to emulate this hands‑on approach as much as possible with their general populations by proactively engaging with and monitoring students. We describe later in this chapter how the CCC Chancellor’s Office could provide guidance and clarify expectations related to this type of proactive engagement.
We also found that the format and content of the five colleges’ student education plans did not clearly meet all of the key criteria we include in the text box. For example, only Clovis and Victor Valley routinely included in the education plans we reviewed the institutions to which students may wish to transfer, largely because their templates have a designated area for that information. The other three colleges did not have such designated areas in their plans—especially those they provided to students through an online format—even though the plans had spaces to document students’ broader education goals and majors. Counselors at these three colleges sometimes included students’ potential transfer destinations in the electronic notes they attached to the plans or wrote to document education plan meetings, but this practice was not standardized. Routinely documenting this element helps ensure that counselors are guiding students to meet the specific requirements of the institutions they wish to attend.
Regulations also require education plans to be accessible and recorded in electronic form. Four of the five colleges we reviewed transitioned to making education plans available through interactive online systems before or during our audit period. Clovis currently provides all of its education plans as PDF documents, an approach that lacks some of the functionality that online systems can provide. These online systems can allow students to access and update their plans at any time and to register for classes through the same system. Moreover, Chancellor’s Office officials told us that all campuses should use an electronic system for education plans. Clovis’s dean of student services stated that the college tried using such a system but that counselors preferred not to use that particular system because it did not accurately account for some key course information and did not come with additional counselor resources for interventions when students make changes to their plans. The dean also stated that Clovis is open to using an electronic education planning system as long as it works accurately and effectively. Notwithstanding Clovis’s concerns, community colleges should be able to ensure both that education plans are accessible online and that staff actively review them.
In fact, CCC’s Vision for Success states that colleges should monitor student progress more closely and intervene more assertively using strategies such as online tools that help students clearly see their own progress toward their educational goals, alerts that remind students of upcoming deadlines, and automatic flags for intervention when students miss an enrollment deadline or fail a class. This type of functionality could help colleges meet another important requirement: reviewing an education plan and its implementation as necessary to ensure that it continues to reflect a student’s needs and goals. The education planning systems at the colleges we visited already include functionalities such as allowing students to request counselor reviews, tracking which counselors have reviewed an education plan, logging the counselors’ notes, and showing whether the student actually enrolled in the planned courses. Wider and more consistent use of these types of interactive education planning systems could help colleges ensure that students receive critical transfer services.
The Five Colleges We Visited Do Not Have Sufficient Numbers of Transfer and Counseling Staff
Several indicators suggest that the five community colleges we reviewed lack the number of staff they require to provide important transfer‑related guidance to students. This is due, in part, to challenges associated with funding additional positions. For example, although regulations require each community college district to designate a location on campus to serve as the focal point of transfer functions (transfer center) and provide staffing for it, transfer center staffing was a concern officials raised at each of the colleges we visited. A college’s transfer center generally coordinates transfer activities. For instance, it may organize transfer outreach events or provide counseling appointments. The CCC Chancellor’s Office recommends that a transfer center have at least three to five full‑time positions, including a director, one or two counselors, and one or two support staff.
However, none of the five colleges we visited had met all of the Chancellor’s Office’s recommended transfer center staffing criteria as of academic year 2022–23. Without adequate staff, transfer centers may struggle to provide guidance and outreach to help students transfer. For example, Victor Valley—which reported only 1.5 full‑time equivalent transfer center positions in 2022–23—conducted a program review that identified transfer center staffing as a challenge and stated that in several instances, students who visited the transfer center left the office without receiving prompt help. The program review also found that students may need to wait up to two weeks for a scheduled appointment. Victor Valley’s transfer center coordinator told us that the college assigned a part‑time counselor to the transfer center in Spring 2024 and is working to hire an additional support staff person. Beyond the five colleges we reviewed, transfer center officials statewide have consistently ranked staffing as the top operational barrier they face.
Staffing challenges also limit students’ ability to receive guidance outside of the transfer center. For colleges’ broader counseling efforts, the CCC Academic Senate recommends that community colleges maintain a ratio of one counselor for every 370 students—and it adopted a resolution in Fall 2022 to work with the CCC Chancellor’s Office to advocate for incorporating that ratio into regulations. However, four of the five colleges we reviewed reported significantly higher ratios, as the text box shows. The colleges used different methodologies to calculate their counselor‑to‑student ratios, making comparisons between them difficult. Nonetheless, officials at all five colleges acknowledged that their levels of counselor staffing were insufficient. For example, a form to request additional counselor positions at Diablo Valley states that there are not enough counselors to meet the student demand for services, and that as a result, it is not uncommon for students to have spent a year or two at the college without seeing a counselor—leading to consequences such as students making mistakes in course selection.
Counselor-to-Student Ratios and the Methodologies Used to Calculate Them at the Five Colleges We Reviewed
Examples of counselor-to-student ratios that the colleges calculated:
Clovis: 1:952 in academic year 2020-2021.
Diablo Valley: 1:538 expected in Fall 2024.
Lassen: 1:234 for its non-incarcerated student population as of academic year 2020-21.*
Santa Ana: 1:891 in Spring 2023.
Victor Valley: 1:724 in Spring 2023.
Examples of the differing methodologies the colleges used to calculate the ratios above:
- Clovis used the full-time equivalent (FTE) of counselors based on the time they have available to meet with students.
- Santa Ana used full-time faculty and excluded part‑time counselors.
- Victor Valley included general students and calculated separate ratios for students in specialized programs.
Source: Internal program reviews, hiring request forms, and related documents from the colleges we reviewed.
* Lassen reported a ratio that year of 1:1,000 for its incarcerated student population. However, Lassen was also the only college we reviewed for which the Chancellor’s Office calculated a ratio below 1:370 in either 2022 or 2023: it calculated a ratio for Lassen of 1:416 in Fall 2022 and 1:256 in Fall 2023.
The CCC Chancellor’s Office has measured and reported counselor‑to‑student ratios in the past: for example, it reported a ratio of one counselor for every 563 students in academic year 2017–18. More recently, it conducted an internal, informal calculation that showed average ratios of 1:420 in Fall 2022 and 1:440 in Fall 2023, with significant variation by college. However, the assistant vice chancellor for data, visualization, and research indicated that the CCC Chancellor’s Office has not established a permanent process for monitoring and reporting these ratios because such monitoring is not a requirement in state law and because these ratios provide limited value in directly measuring student success. Specifically, he added that although the ratios are informative about workloads, their value is limited because they do not show the full picture of the factors that directly impact student success. Nevertheless, establishing a consistent methodology to measure and report community colleges’ counselor‑to‑student ratios could help the CCC Chancellor’s Office identify where staffing challenges may be affecting students’ ability to receive critical guidance about transferring.
Funding is a key barrier to increasing staffing levels. The CCC Academic Senate has stated that as colleges receive new funding to provide for an increase in student enrollment, they do not simultaneously receive equal funding to increase support services, such as counseling. In addition, a state law—commonly referred to as the 50 percent law—requires community college districts to annually spend at least half of their education expenses on the salaries of classroom instructors. Because the law does not allow a college to include the portion of a salary that is related to counseling as an instructional cost, hiring counselors can make it difficult for colleges to comply with the law. Four of the five community colleges we reviewed indicated that funding limitations like this hinder their ability to hire counselors. The fifth college, Santa Ana, classifies its counselors as faculty who perform both counseling and counseling‑related instruction, which it has concluded allows the college to include counselors as part of the salaries of classroom instructors. The State has earmarked funding for some specialized programs, such as EOPS, which community college officials told us is not subject to the 50 percent law and can result in these programs having more counselors per eligible student. However, these programs do not serve the general student population.
The Colleges We Reviewed Could Improve Their Plans for Helping Underrepresented Students Transfer
State law and CCC goals establish that community colleges should provide services to students from historically disadvantaged or underrepresented groups to help them achieve outcomes like successfully transferring. For example, state law established the Student Equity and Achievement Program to assist community colleges in boosting the achievement of all students with an emphasis on eliminating achievement gaps for students from traditionally underrepresented groups in higher education. As we explain in Chapter 1, significant gaps still exist in transfer rates between certain demographic groups, likely for a variety of reasons—some of which may be difficult for community colleges to address. However, colleges can position themselves to reduce achievement gaps as much as possible by identifying the causes for their gaps and measuring the effectiveness of their subsequent efforts to address those causes.
State‑mandated equity plans are community colleges’ most comprehensive tool for addressing gaps in transfer outcomes. State law requires community college districts to maintain student equity plans for each college in exchange for receiving Student Equity and Achievement Program funding to serve, among others, high‑need or disadvantaged students, whom the equity plans refer to as disproportionately impacted students. To meet this requirement, the CCC Chancellor’s Office collects an updated equity plan for each college every three years that includes the college’s research about equity gaps, describes its goals for disadvantaged groups, and identifies specific activities that are likely to help it meet those goals and address disparities. Transfer rates are one important metric, but these plans also measure gaps related to other outcomes, such as student retention and certificate and degree completion.
As part of their student equity plans, colleges are asked to identify the causes of their transfer‑related equity gaps so they can begin to address them. However, we were unable to determine if the five colleges we reviewed had appropriately performed this step because their equity plans did not always articulate how they had researched and established these causes. For example, Santa Ana’s and Victor Valley’s 2022–25 equity plans identified students’ lack of awareness of transfer requirements and resources as a key structural barrier to transfer, but the plans did not specify how the colleges had arrived at this conclusion—such as by analyzing data to show disproportionate awareness of transfer across demographic groups. Although the equity plans of these two colleges indicated that they had conducted student surveys, it was unclear whether the survey results informed their analyses of structural barriers, and their plans stated that the colleges intended to regularly review data to further understand why gaps may persist. In Diablo Valley’s plan, the college wrote that it lacked the infrastructure to conduct deeper inquiries to understand the causes of its equity gaps and the effectiveness of its existing activities to address those gaps. Without a more complete understanding of the underlying causes of students’ disproportionate outcomes, colleges are not in a position to most effectively use their limited resources to close equity gaps.
Although the CCC Chancellor’s Office has produced an equity plan template that asks colleges to identify structural barriers that have produced inequitable outcomes and to include changes they will make to reduce those inequities, it does not provide guidance about how to correctly identify the causes of those barriers. This lack of detail contrasts with the guidance the CCC Chancellor’s Office has provided in other areas: for instance, it established guidance for how colleges should measure which demographic groups experience the largest gaps in equity.
Over the course of our audit period, the CCC Chancellor’s Office improved certain aspects of its template and guidance for colleges’ equity plans. During this period, community colleges submitted two equity plans: one covering academic years 2019 through 2022 and a second for academic years 2022 through 2025. The CCC Chancellor’s Office made several changes to its template and guidance between these two plans. For instance, the 2019 through 2022 equity plan template asked colleges to evaluate all equity gaps for each metric, whereas the 2022 through 2025 template asked colleges to focus on at least one disproportionally impacted student group for each metric, including transfer. Although not all of the five colleges we reviewed made similar statements, Diablo Valley and Lassen both indicated that the broader focus of the first version of the equity plan template reduced its effectiveness.
In general, the CCC Chancellor’s Office’s changes have provided a more focused approach for identifying and addressing specific equity gaps. However, the changes to the equity plan template and the format in which colleges have reported their progress—including within annual updates—have made it difficult to hold colleges accountable for implementing action items. In particular, the equity plans covering 2022 through 2025 for the five colleges we reviewed did not provide clear information about whether the colleges had implemented their planned activities from the prior equity plan or whether they had experienced success in closing equity gaps because of those activities. Although the new template contains a section for colleges to summarize the activities from 2019 through 2022, the colleges we reviewed often included only lists of all their recent activities or initiatives without explaining which student populations those activities served or how successful they were in meeting their own goals. Figure 23 summarizes our concerns about the equity plan with respect to monitoring colleges’ progress.
Figure 23
The Template for Community Colleges’ Equity Plans Does Not Ensure That Colleges Adequately Track and Report Their Progress
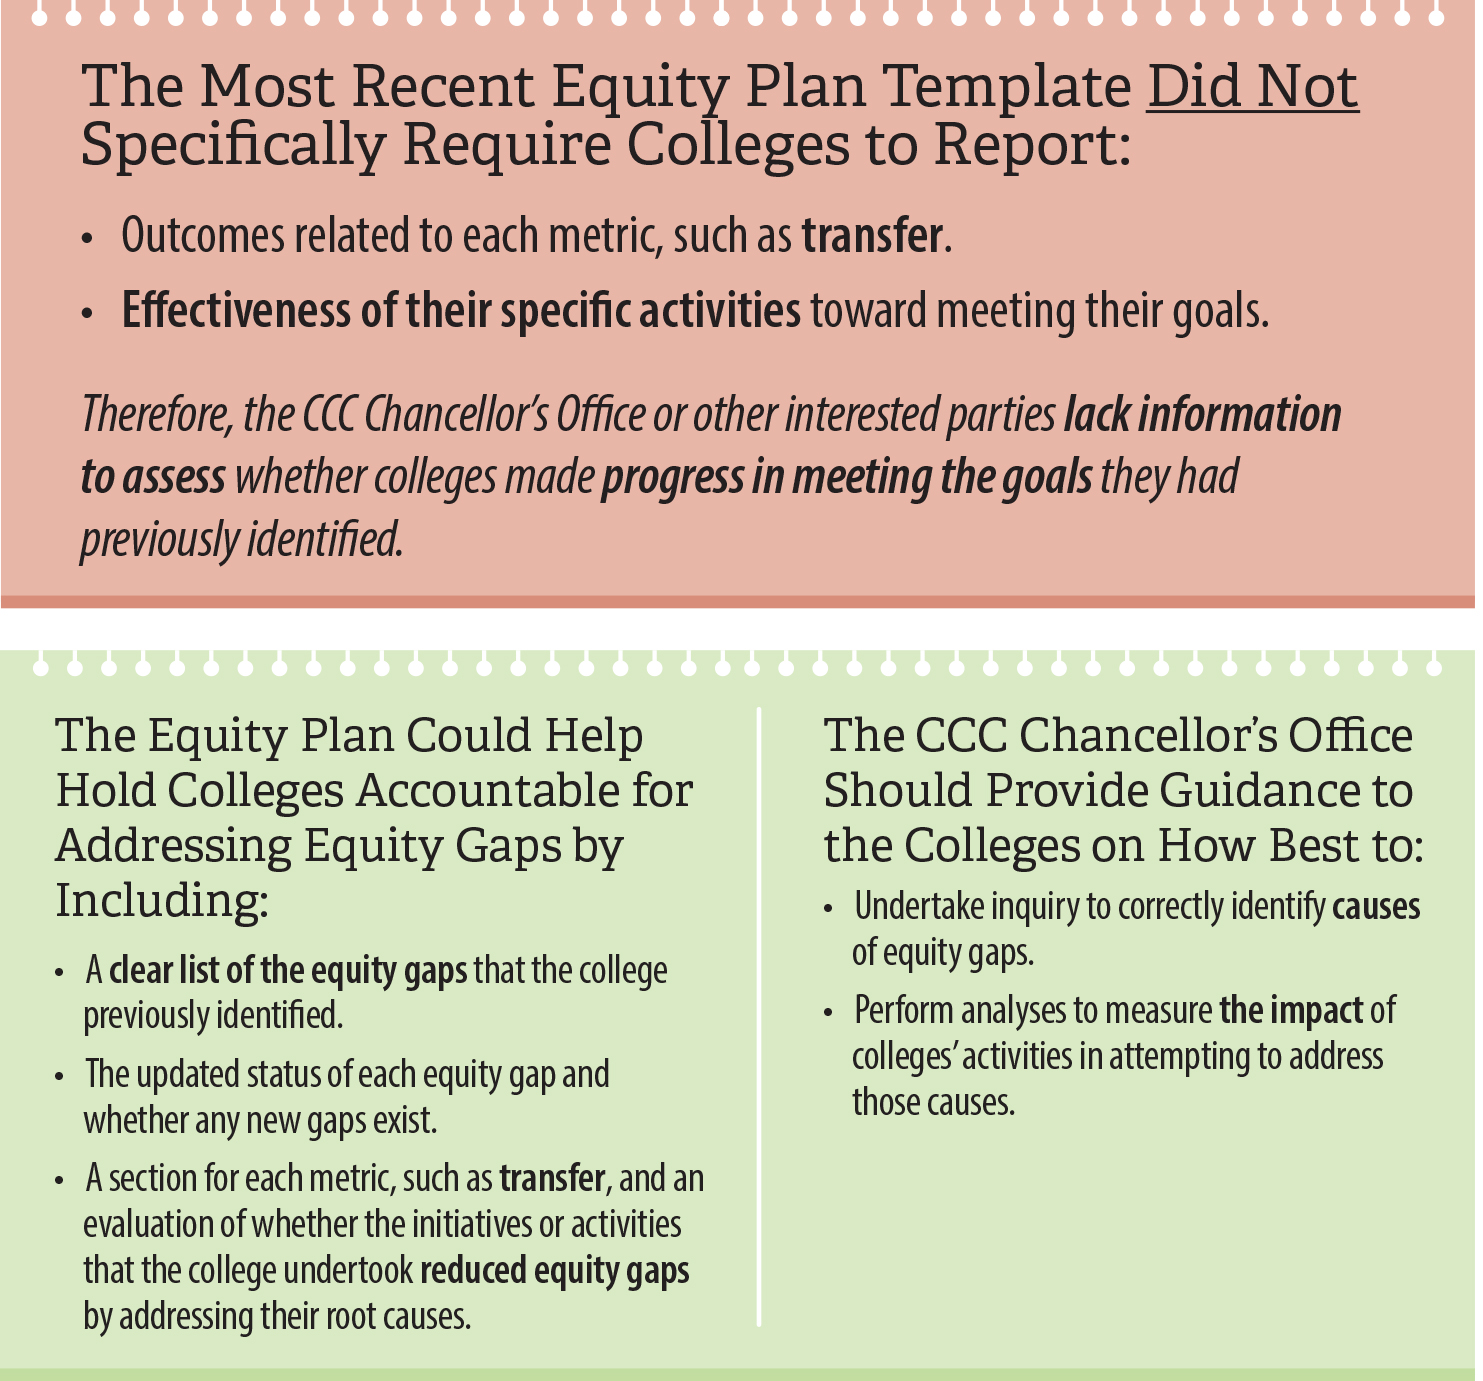
Source: CCC Chancellor’s Office template for the Student Equity Plan covering 2022 through 2025 and analysis of selected colleges’ equity plans.
Figure 23 is a graphic that shows that the template for community colleges’ equity plans does not ensure that colleges adequately track and report their progress. A box at the top of the graphic explains that the most recent equity plan template did not specifically require colleges to report outcomes for various metrics, such as outcomes related to transfer, nor did it require colleges to report the effectiveness of their specific activities toward meeting their goals. A box at the bottom of the graphic provides examples of how equity plans could better hold colleges accountable for addressing equity gaps and explains that the CCC Chancellor’s Office should provide guidance to colleges, including for helping colleges undertake inquiry to identify causes of equity gaps.
Beyond the initiatives contained in their equity plans, community colleges may also address demographic disparities in metrics such as transfer rates through special programs that serve traditionally underrepresented groups. These programs can have several benefits for students, including priority registration, financial aid or other monetary benefits, counseling and tutoring, and a dedicated study space. However, these programs are often too limited in their funding and resources to serve all underrepresented students. For example, Umoja—a learning community dedicated primarily to the academic success of Black or African American students—exists at more than half of all community colleges in the State, but it served only 6,200 students during Fall 2022, which was less than 9 percent of the 70,400 Black or African American students enrolled statewide. Because these programs are unlikely to be able to reach all students who could benefit from them, it is even more critical that colleges develop thorough and effective equity plans to guide their efforts in reducing demographic disparities.
The CCC Chancellor’s Office Could Provide More Specific Guidance and Monitoring to Help Improve Colleges’ Transfer Efforts
When we asked officials in the CCC Chancellor’s Office about its guidance and oversight related to the issues we describe throughout this section, they provided several examples of existing systemwide guidance and professional development opportunities, such as guidance that all students should develop an education plan. However, the officials also acknowledged that limited authority and resources can be a challenge: for example, they stated that the Chancellor’s Office does not provide customized guidance that delves into each college’s operations and unique circumstances because that falls within the sphere of local control. We recognize that the CCC system is decentralized and involves significant local control at the community college district level. Even so, these limitations do not preclude the CCC Chancellor’s Office from taking a greater role in certain critical areas. In fact, state law requires the Chancellor’s Office to establish guidelines related to the provision of counseling and education plans. Because the CCC system has already established regulations for these critical services, the Chancellor’s Office is well positioned to provide more specific guidance to colleges and monitor whether they are adhering to the regulations.
The CCC Chancellor’s Office currently monitors colleges’ transfer‑related efforts primarily by collecting and publishing certain data and by overseeing the colleges’ mandated transfer center reports and equity plans. It is also currently developing a Vision‑Aligned Reporting system, which will be designed in part to help track and analyze colleges’ student service metrics—including certain transfer and counseling metrics. However, as part of these efforts, it could improve aspects of its oversight to address some of the concerns we discuss earlier. For example, it already collects and publishes data about community colleges’ education planning and counseling services, but these data do not show the percentage of students who have current, comprehensive education plans or the percentage who have received timely counseling services. Chancellor’s Office officials agreed that publishing this type of data may be useful for improving the State’s transfer efforts but would require a clear and consistent methodology for colleges to provide and for users to interpret the data. Further, the CCC Chancellor’s Office could provide more detailed guidance about the specific actions colleges should take—such as the practice of identifying and reaching out to students without education plans—to monitor students’ progress and ensure that as many students as possible have received critical guidance to help them transfer.
CSU and UC Could Use CCC Data to More Effectively Engage Transfer‑Intending Students Early in Their College Education
Like CCC, CSU and UC also have roles in helping community college students understand transfer requirements and navigate barriers. State law makes all three systems of higher education responsible for providing students with clear information about transfer options. CSU’s and UC’s efforts in this area are clearly critical given that they impose specific requirements that community college students must meet to be eligible for transfer. As the text box shows, best practices exist for CSU and UC to help students navigate the transfer process. Although CSU and UC have several programs and methods for advising community college students, the systems have lacked the CCC data necessary to identify and reach transfer‑intending students early in the transfer process. As a result, some students may not receive resources and information from CSU and UC that could help them transfer.
Best Practices for Universities Providing Information to Transfer-Intending Students
1. Identify potential transfer students.
2. Conduct targeted communications, outreach, and recruitment.
3. Provide tailored advising and counseling.
Source: Reports from the Aspen Institute, the Western Interstate Commission for Higher Education, the National Institute for the Study of Transfer Students, and the California Governor’s Council for Post-Secondary Education.
CSU and UC campuses provide outreach and guidance to community college students, but their efforts can be limited in scope without data to identify and contact transfer‑intending students more effectively. For example, Stanislaus State embeds advisors at three local community colleges. According to its dean of admissions, this approach allows the advisors to contact potential transfer students earlier in their collegiate paths. However, the benefits of this program are understandably limited to students at those three community colleges. CSU and UC campus representatives also host and attend various informational events for transfer students, but these events similarly may not reach all students who intend to transfer.
Similarly, CSU and UC have systemwide programs and processes to help transfer‑intending students, but the systems could reach more of these students if they used CCC data to systematically identify them. For example, as the text box shows, both systems offer online transfer planning tools that provide useful information for those students who are aware of them. In compliance with state law, both systems have also pursued dual admission programs that could help eligible students transfer more easily. Although transfer planners and dual admission programs are helpful resources for advising and supporting students, they may not reach all eligible students, especially if students are not sure of their specific transfer goals.
CSU and UC Each Have Systemwide Planning Tools and Programs for Transfer‑Intending Students
CSU and UC each have their own versions of the following:
Transfer planners are online tools that allow community college students to log their community college coursework to track their progress. The transfer planners also provide students with important information from the university system, such as major-specific feedback before application periods and information about upcoming visits from campus admission representatives.
Dual admission grants high school seniors who meet certain requirements, including attending a California community college, conditional admission to a CSU or UC campus.
Source: CSU and UC websites and state law.
Officials at the CSU and UC campuses we visited said that they have been largely dependent on community college students identifying themselves as transfer‑intending students or independently learning of key tools and programs. One reason has been that the three systems—CCC, CSU, and UC—operate independently of each other in many ways, as we discuss in Chapter 2. Thus, data on transfer‑intending students largely exists in CCC’s data system but not in CSU’s and UC’s systems.
In 2021 the California Governor’s Council for Post‑Secondary Education recommended that the State implement an integrated admissions platform by 2030 that could provide CSU and UC with comprehensive information on transfer‑intending students. In the meantime, the three systems could coordinate their efforts to provide greater numbers of transfer‑intending students with key transfer information and thus increase transfer rates. Specifically, by sharing community college data with CSU and UC campuses, CCC could help those campuses reach out to students, which could facilitate the transfer process as Figure 24 shows. CCC could share data specifically for students who have indicated their intent to transfer or who demonstrate behavior consistent with intending to transfer, similar to our method for establishing cohorts of transfer‑intending students. CSU and UC could use the data to provide tailored advising and help guide the students to successfully transfer. Finally, CSU and UC should continue to share data with CCC about their students who have successfully transferred, to enable individual community colleges to evaluate the success of their transfer‑related efforts.
Figure 24
The Sharing of Community College Data Would Help CSU and UC Campuses More Effectively Facilitate Transfer
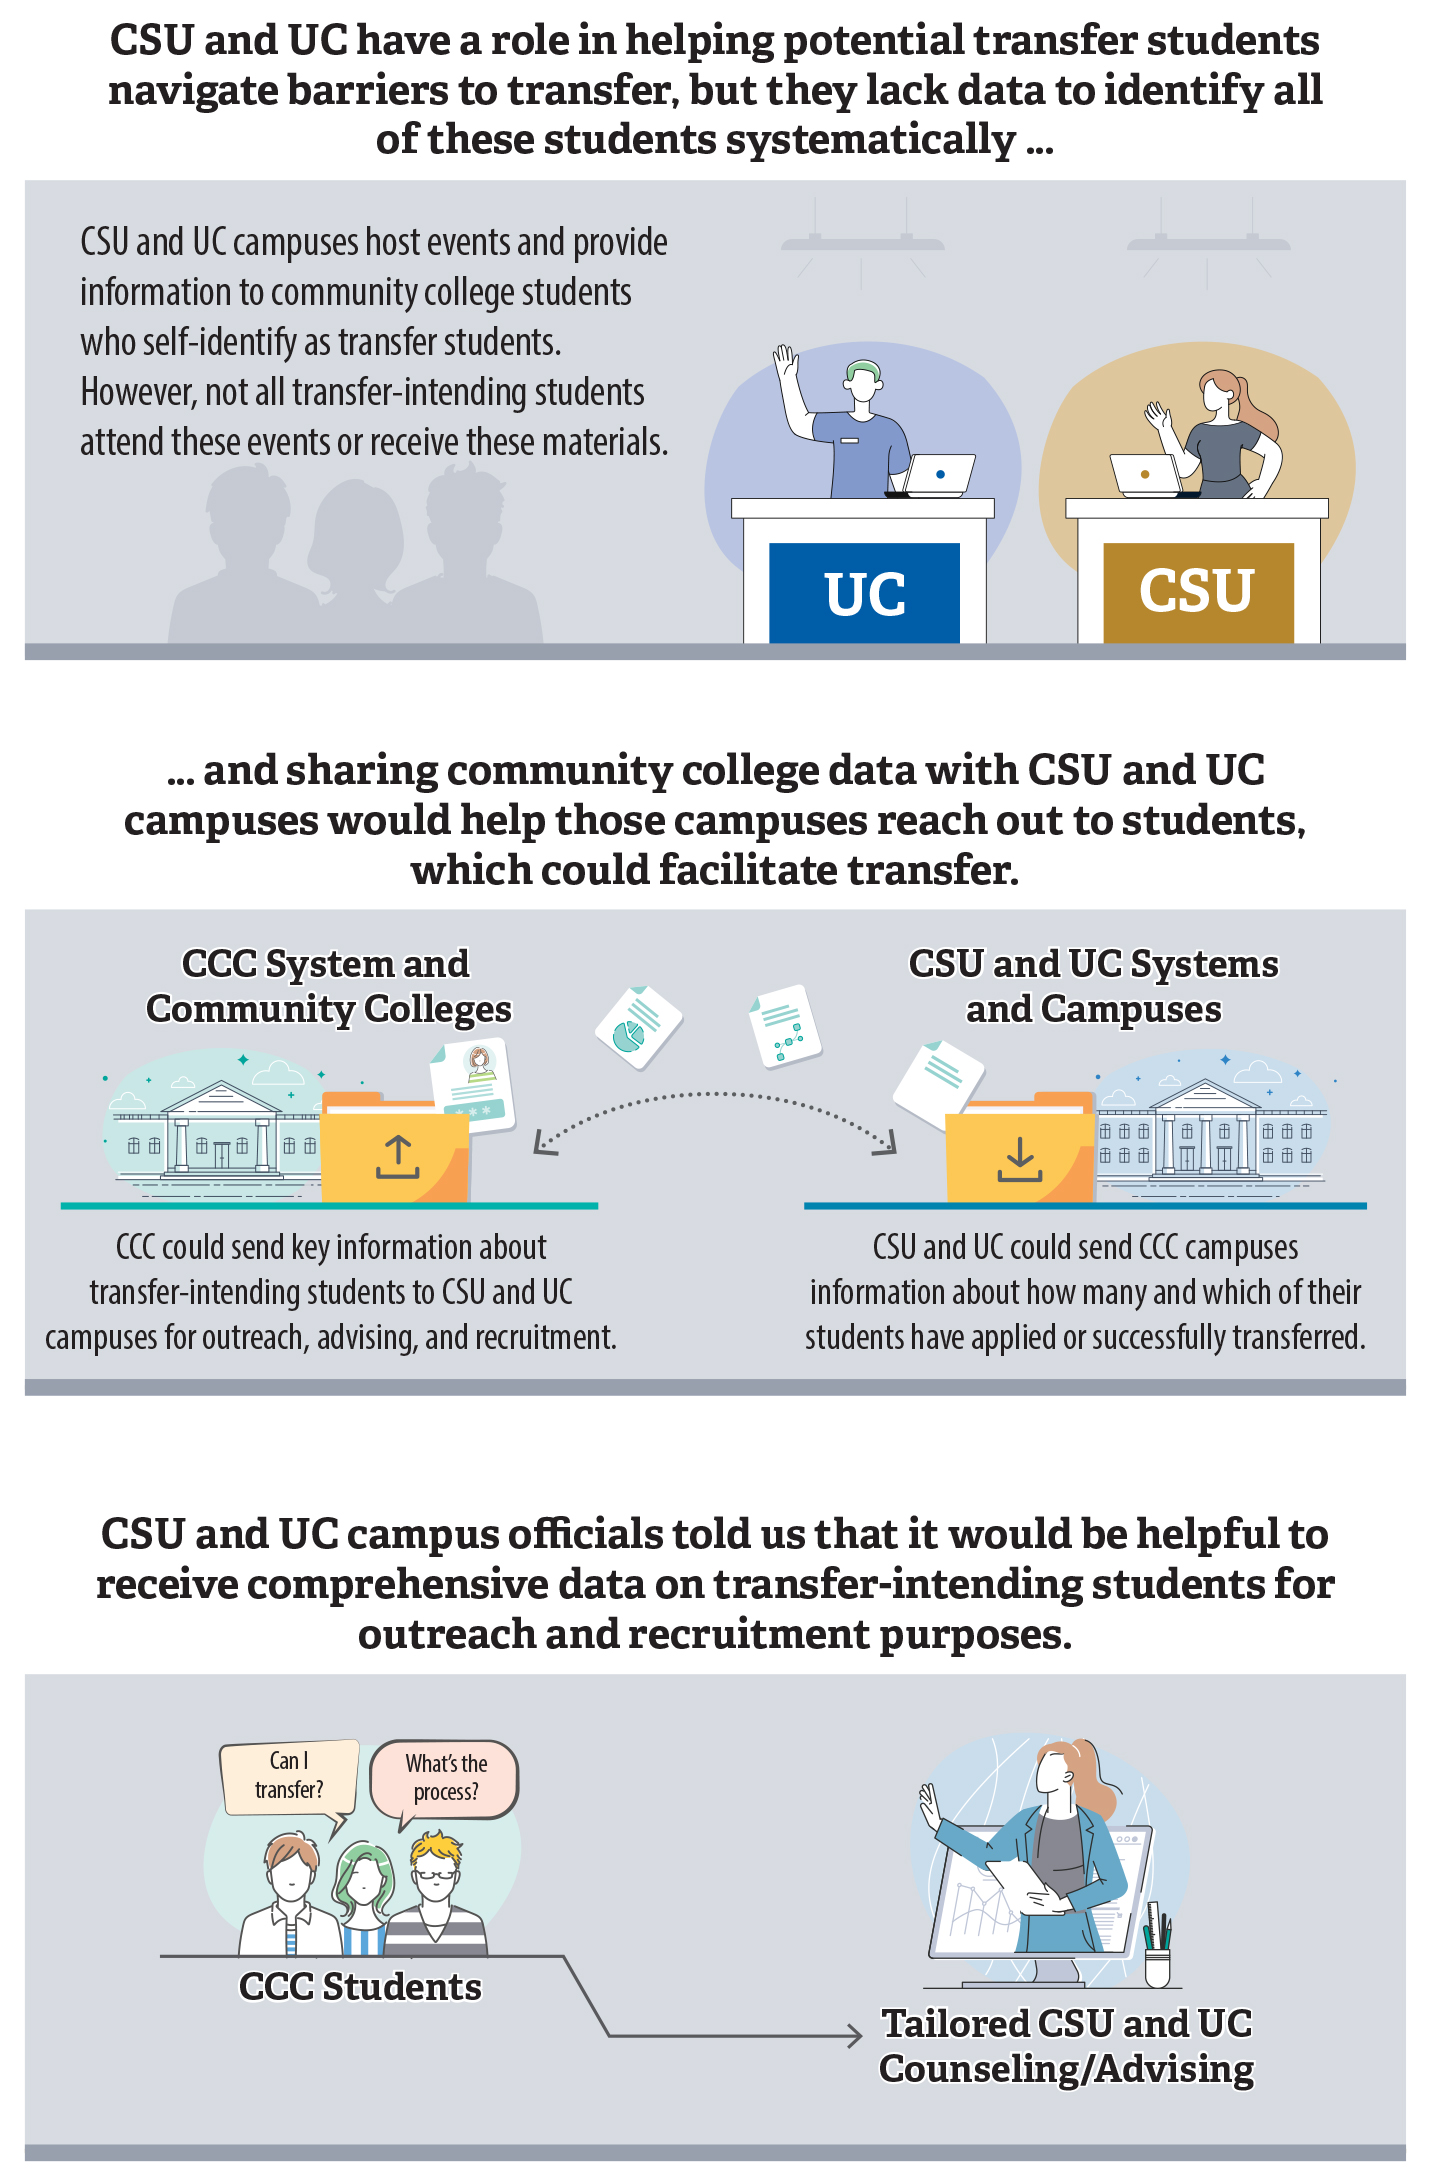
Source: Analysis of CSU and UC programs, services, and data sharing agreements, and interviews with system and campus officials.
Figure 24 is an infographic that demonstrates how the sharing of community college data would help CSU and UC campuses more effectively facilitate transfer. The first panel explains that although CSU and UC have a role in helping transfer-intending students navigate barriers to transfer, they lack data to identify all of these students systematically. The next panel shows that sharing community college data with CSU and UC campuses would help those campuses reach out to the appropriate students. Specifically, the community college system could send key information about transfer-intending students to CSU and UC campuses for outreach, advising, and recruitment, and CSU and UC could send CCC campuses information about how many and which of their students have applied or successfully transferred. Finally, a third panel explains that CSU and UC campus officials told us that it would be helpful to receive comprehensive data on transfer-intending students so as to be able to provide them services such as tailored counseling and advising.
The three systems have already begun to take steps toward this type of data sharing. Most notably, officials from the CCC Chancellor’s Office and UC Office of the President stated that in Fall 2023, CCC began sharing with UC some of its enrollment data—such as students’ basic contact information and fields of study—for purposes of outreach. However, the data did not include when the students intended to transfer. According to UC Santa Barbara’s executive director of admissions, the data did not allow that campus to identify potential transfer students. For instance, UC Santa Barbara contacted students from the data who informed it that they did not intend to transfer—such as an older student who was taking an art class for personal benefit. CSU’s assistant vice chancellor of enrollment management services informed us that CCC has also shared data with CSU about community college ADT earners for purposes of outreach but that CSU currently does not have any formal memorandums of understanding with CCC on data sharing for outreach purposes.
Officials at each of the CSU and UC campuses we reviewed told us that it would be helpful for them to receive comprehensive data on potential transfer students for outreach and recruitment purposes. In fact, UC Santa Barbara’s executive director of admissions stated that she believes all UC campuses would benefit from having contact information from community college campuses for outreach purposes. Although legal barriers exist to sharing students’ data, they do not appear to prevent CCC from sharing helpful information about transfer-intending students. The federal Family Educational Rights and Privacy Act of 1974 (FERPA) generally requires colleges and universities that receive federal education funding to have written permission from a student in order to release information from that student’s education record. However, there are some exceptions, including for disclosing directory information such as a student’s name, address, major, and degrees received. More significantly, CCC’s application for new community college students asks them if they consent to share their personal information to universities to promote outreach and to enhance transfer.
Nonetheless, officials from the three systems stated that data quality and timing pose challenges to the success of this type of data sharing. CCC Chancellor’s Office officials explained that the community colleges use different tools to record information that is received during counseling or academic planning sessions, and they do not share information about students’ potential transfer destinations with the Chancellor’s Office. As a result, it may be difficult for the CCC Chancellor’s Office to collect and share information about the specific CSU and UC campuses to which students are interested in transferring. Those officials also stated that the CCC Chancellor’s Office does not have up‑to‑date contact information for community college students because it does not receive directory information from the colleges. The officials further added that the Chancellor’s Office does not receive fall term data from colleges until at least the end of January, which may be too late for students to receive guidance about critical issues such as the spring term courses that would best prepare them to transfer. CSU’s assistant vice chancellor of enrollment management services agreed that the timing of data sharing for outreach purposes is important. She added that CSU would need this information at least a year before students complete their community college education to have enough time to reach out to them so the student avoids a break in their enrollment when transferring.
CCC Chancellor’s Office officials added that establishing a common information system for all community colleges would help solve these issues, as well as many other challenges. Such a system could allow the Chancellor’s Office or other entities to access accurate, updated information about the transfer‑intending students at each community college. However, Chancellor’s Office officials indicated that such a system could cost well over $100 million and take several years to implement.
Recommendations
CCC Chancellor’s Office
To help community colleges provide students with the information they need to transfer, the CCC Chancellor’s Office should disseminate guidance to districts and colleges by September 2025 that includes the following:
- Specific actions that districts or colleges should take to ensure that as many transfer‑intending students as possible receive counseling and have a current, comprehensive education plan. For example, these actions could include routinely identifying and reaching out to schedule counseling appointments with the specific students who do not have a current, comprehensive education plan.
- Guidance about the format and content of education plans, including how districts or colleges can ensure that the plans are accessible online and contain a student’s potential transfer destinations. The guidance should also include any ways in which online education planning systems could assist districts or colleges in meeting the objectives we include in this recommendation.
To help evaluate and improve colleges’ efforts to advise students about transfer, the CCC Chancellor’s Office should develop a method by September 2026 for community colleges to monitor and report the percentage of their transfer‑intending students who have a current, comprehensive education plan and the percentage who have received timely counseling services. For example, the Chancellor’s Office could refine the data that it collects and publicly reports to ensure that it shows these types of metrics. Further, the Chancellor’s Office could consider following up with districts or colleges that have low percentages of such students to help them improve.
To help ensure that community colleges have the staffing necessary to assist transfer‑intending students, the CCC Chancellor’s Office should establish a process by September 2025 for identifying community colleges with staffing levels that are insufficient to provide necessary transfer‑related guidance and taking follow‑up action when warranted. For example, using existing staffing criteria and information it already collects, the Chancellor’s Office could identify colleges that lack sufficient transfer center staffing or have inadequate counselor‑to‑student ratios. It could then notify or follow up with officials at these colleges to help advocate for increasing their staffing levels or to support the colleges’ efforts in other ways.
To ensure that colleges are making effective efforts to close equity gaps in student transfer rates, the CCC Chancellor’s Office should update its equity plan template or its related equity plan annual report template by September 2025 to require colleges to report outcomes related to their established goals. The Chancellor’s Office should also provide guidance to help colleges address the root causes of their transfer‑related equity gaps and to evaluate the effectiveness of their initiatives designed to reduce those gaps.
CCC Chancellor’s Office, CSU Chancellor’s Office, and UC Office of the President
To improve outreach efforts and help students transfer, the three systems should establish formal agreements by September 2025 to share information for outreach and recruitment purposes about transfer‑intending students in a manner permitted by FERPA and any other applicable privacy laws. The agreements should:
- Ensure that the information that CCC shares with CSU and UC is specific, detailed, and timely enough to allow CSU and UC campuses to conduct tailored outreach to students to help them transfer. In particular, the CCC Chancellor’s Office should evaluate its options for determining students’ intent to transfer and work with CSU and UC to ensure that the data it shares is useful for their campuses’ outreach purposes.
- Specify that CSU and UC will also regularly share information with CCC about their students who successfully transferred, in a format and level of specificity that allows community colleges to assess the effectiveness of their transfer efforts.
We conducted this performance audit in accordance with generally accepted government auditing standards and under the authority vested in the California State Auditor by Government Code section 8543 et seq. Those standards require that we plan and perform the audit to obtain sufficient, appropriate evidence to provide a reasonable basis for our findings and conclusions based on the audit objectives. We believe that the evidence obtained provides a reasonable basis for our findings and conclusions based on our audit objectives.
Respectfully submitted,
GRANT PARKS
California State Auditor
September 24, 2024
Staff:
Vance Cable, Audit Principal
Michelle Sanders, PMP, Audit Principal
Nick Versaci, Senior Auditor
Maggie Carroll
Taylor Gray, Ph.D.
Bikash Gupta
Parris Lee
Data Analytics:
Ben Ward, MSA, CISA, Audit Principal
Ryan P. Coe, MBA, CISA
Andrew Jun Lee
Grant Volk, MA, CFE
Legal Counsel:
Natalie Moore
Appendices
Appendix A
CCC TRANSFER DATA
We used data from CCC to create cohorts of transfer‑intending students who enrolled as first‑time CCC students during academic years 2017–18, 2018–19, and 2019–20. We then used data from CCC, CSU, and UC to determine the cohorts’ students’ rates of transfer and to explore related trends. Table A.1 shows the statewide rates of transferring within four years of enrolling in the CCC system for students in our 2017, 2018, and 2019 cohorts. Table A.2, Table A.3, and Table A.4 display the colleges or campuses with the highest and lowest transfer rates within the CCC, CSU, and UC systems. Table A.5 and Table A.6 show that transfer rates vary by demographic group and region. Finally, Table A.7, Table A.8, and Table A.9 present information related to students’ earned college units, time spent in community college, and degrees earned before transfer.
Appendix B
CSU TRANSFER DATA
We used CSU’s application and enrollment data to identify trends in application denials and admissions and in enrollments of transfer applicants from CCC. Table B.1 shows that the CSU system as a whole admitted more than 90 percent of community college transfer applicants to at least one campus. However, Table B.2 shows that admission rates varied significantly by individual campus. Table B.3 and Table B.4 also show that admission decisions varied across several demographic categories relative to the applicants’ GPAs and the types of degrees they earned. Table B.5 examines more closely the degrees applicants earned and shows that students who transferred from a community college with an ADT graduated with fewer accumulated units than their peers. Finally, Table B.6 shows admission decisions grouped by academic discipline.
Appendix C
UC TRANSFER DATA
We used UC’s application and enrollment data to identify trends in application denials and admissions and in enrollments of transfer applicants from community colleges. Table C.1 shows that the UC system as a whole admitted more than 75 percent of community college transfer applicants to at least one campus during our audit period. However, Table C.2 shows that admission rates varied significantly by individual campus. Table C.3 and Table C.4 also show that admission decisions varied across several demographic categories relative to the applicants’ GPAs and the type of pathway they completed. Finally, Table C.5 shows admission decisions grouped by academic discipline.
Appendix D
SCOPE AND METHODOLOGY
The Joint Legislative Audit Committee (Audit Committee) directed the California State Auditor to conduct an audit of the CCC Chancellor’s Office, the CSU Chancellor’s Office, and the UC Office of the President to evaluate California’s higher education systems’ efforts to improve the rate of community college transfers to CSU and UC. Table D lists the objectives that the Audit Committee approved and the methods we used to address them. Unless otherwise stated in the table or elsewhere in the report, statements and conclusions about items selected for review should not be projected to the population.
Assessment of Data Reliability
The U.S. Government Accountability Office, whose standards we are statutorily obligated to follow, requires us to assess the sufficiency and appropriateness of computer‑processed information that we use to support our findings, conclusions, or recommendations. In performing this audit, we relied on student and course data that we obtained from CCC and admission and enrollment data that we obtained from CSU and UC. To assess the reliability of these data, we reviewed existing information about the data systems, interviewed people knowledgeable about the data, performed dataset verification, and performed electronic testing of key data elements. As a result of this testing, we found the data to be sufficiently reliable to support our findings, conclusions, and recommendations.
Responses
California Community Colleges, Chancellor’s Office
California State University, Office of the Chancellor
University of California, Office of the President
California Community Colleges, Chancellor’s Office
August 28, 2024
State Auditor
California State Auditor
621 Capitol Mall, Suite 1200
Sacramento, CA 95814
Dear Mr. Parks:
Thank you for the opportunity to respond to the California State Auditor’s report around streamlining the process for students to transfer from community college to a four-year public university; we appreciate the collegial and exceptional work you and your team have put into this challenging area in developing this important report and look forward to future discussions with the Legislature and our four-year partners about implementing the report’s recommendations.
In September 2023, the California Community Colleges Board of Governors adopted Vision 2030, a bold new framework for action to improving the lives and conditions of millions of Californians through our 116 open-access colleges. A central strategic direction of Vision 2030 is equitable baccalaureate attainment – ensuring that students who desire the knowledge and skills conferred by a bachelor’s degree have access to such a pathway at minimal cost, either through transfer to the California State University (CSU), the University of California (UC), partnering independent nonprofit four-year institutions, or through one of our expanding community college baccalaureate programs.
We value our collaboration with our four-year partners through the continued implementation of the Associate Degree for Transfer (ADT) pathway at the CSU, the forthcoming trial of the ADT as a pathway to the UC, and recent state investment in Program Pathways Mapper that represents intersegmental baccalaureate completion pathways and the new “dual admissions” programs being implemented at both segments. At the same time, we are pleased to be able to offer baccalaureate degrees of our own, especially for our large number of “place bound” students, many of whom are located far from a four-year public university and cannot commute or move. Thanks to the support of the Legislature in passing Assembly Bill 927 in 2021, 37 community colleges now offer 45 four-year bachelor’s degrees in critical fields ranging from dental hygiene to cybersecurity and data analysis.
With regard to your findings and recommendations, we remain concerned about ongoing equity gaps in transfer attainment by our students, something that is front and center in our Vision 2030 goals for our system, and we appreciate you highlighting other areas, such as addressing students’ basic needs, that have an outsized impact on our transfer success rates. A persistent challenge for us remains consistent and timely data. Due to the decentralized nature of our system, the lack of a common data platform hampers our ability to collect timely and reliable data on transfer rates and gaps and hinders our ability to be able to accelerate transfer for the students of California through real-time data sharing with four-year system and institutional partners. “Let the data flow” has been a consistent mantra of mine since becoming chancellor in 2023, and I look forward to carrying forward recommendations around improvements to our data, research, and systemwide policy leadership.
We understand the recommendations around access to transfer counseling. Our colleges often use all counselors to support transfer-seeking students, whether they are assigned to Umoja programs, Extended Opportunity Programs and Services (EOPS), general counseling, or the Transfer Center of the institution. Even so, reliable digital infrastructure at the colleges remains a concern to track, document, and monitor student progress and interactions, something our system is working hard to address through our reimagination of key digital tools like CCC Apply, the Common Data Platform and eTranscript and the continued development of Program Pathways Mapper to assist both students and college staff supporting them to have ready access to the information necessary to improve their readiness for and ability to transfer. Our colleges are also affected by a longstanding state law that requires 50% or more of educational expenses to go towards instructor salary and benefits, but the salaries and benefits of faculty who are counselors are not accounted for in the numerator of the 50% law. Further, this limits our ability to maximize investments in digital infrastructure and counseling services. We will continue to work to find creative solutions to address the need for more counseling support and implement the recommendations of the report while maintaining compliance with the laws governing funding and expenditures.
Thank you for the chance to respond to this audit and for your hard work on this critical issue.
Sincerely,
Sonya Christian
Chancellor, California Community Colleges
California State University, Office of the Chancellor
August 28, 2024
Mr. Grant Parks
State Auditor
California State Auditor
621 Capitol Mall, Suite 1200
Sacramento, California 95814
Dear Mr. Parks:
Thank you for the opportunity to review and respond to the draft audit report on Community College Transfers. The CSU agrees with the recommendations detailed in this audit report and will work to implement them.
The CSU values the tens of thousands of California Community College transfer students it admits every year and recognizes that transfer students have been essential to the success of the CSU since its inception.
Strengthening transfer pathways is a top priority for the CSU. To this end, the CSU launched the Transfer Success Pathway program and the CSU Transfer Planner application in summer 2023. In addition, the CSU continues to expand the number of Associate Degree for Transfer (ADT) similar pathways it offers and improve the transfer student experience.
On behalf of the CSU, I extend my appreciation to the audit team for their hard work and collaboration throughout the audit process.
Sincerely,
Mildred García, Ed.D.
Chancellor
University of California, Office of the President
August 28, 2024
2023-123—CSA Confidential Audit Report
UC Office of the President Response
I appreciate the time and effort the California State Auditor’s (CSA) office committed to identifying ways in which the University of California can increase accessibility for community college transfers and improve the overall transfer process. Supporting California students in successfully transferring to the University has been and continues to be a top priority.
The University shares the goals of CSA’s report, which align with the significant progress we have made since the 2018 MOU between the UC Office of the President and the California Community College Chancellor’s Office. Through this partnership, our institutions are working to ensure that transfer students have the support they need not only to enroll, but also to graduate and succeed after college. Adequate preparation of transfer students for upper division work in their major is essential for student success.
The University also continues to work closely with the Legislature and the Governor on ways to prioritize enrollment goals, including expanding access for California resident undergraduates as well as transfer students, while balancing the limited space available at our campuses. We share report’s goal of increasing transparency about how campuses and disciplines are making progress toward these targets. Campuses use many factors to determine enrollment targets appropriate for their respective departments and majors. These factors include student demand, faculty and staff levels, and physical space, and are unique to every campus. UCOP does not have the same level of local information or expertise to make these decisions on their behalf.
We are proud that fall enrollments of UC students who started in the California Community Colleges grew from around 37,000 in fall 2015 to 46,500 in fall 2021. While there have been declines in transfer applicants post-pandemic, we are optimistic those numbers will recover. As we look to the future, the University remains deeply committed to expanding opportunity and access for all California students, including the nearly one-third of entering UC students each year who are transfers.
After the release of the report, my office will work with the Academic Senate and our campuses to further review the audit findings and map out a course of action needed to implement the recommendations. We look forward to continuing our work with state and local education leaders and partners to improve the transfer process.
Sincerely,
Michael V. Drake, MD
President
- Lower‑division education typically encompasses the first two years of a four‑year degree program and includes courses that may be prerequisites for upper‑division courses, and upper‑division typically encompasses the final two years, with courses more specific to the major program of study. ↩︎
- UC’s goal includes only California resident students. Because CSU had not adopted a related goal at the time of our audit, we used a methodology similar to UC’s to calculate the transfer representation goal in our review of both systems, as we explain in Chapter 1. Like UC does, we limited our calculations to resident students. ↩︎
- Research has identified that some students may struggle to complete transfer‑level English and math courses. The Legislature passed Assembly Bill 705 in 2017, which required community colleges to maximize the probability that a student will enter and complete transfer‑level coursework in English and math within a one‑year time frame, in part by using measures such as high school coursework and grades to place students into English and math courses and to generally avoid placing students into remedial coursework. According to the Public Policy Institute of California, significantly more students are now completing transfer‑level English and math courses than before the bill’s passage. ↩︎
- CSU and UC generally require upper‑division transfer students to have obtained at least 60 transferable semester units—equivalent to about two years of full‑time enrollment. However, on average, students who transfer to CSU or UC exceed this minimum number of units, as Table A.7 in Appendix A shows. ↩︎
- CSU’s dashboard numbers differ from the campus‑specific admission rates we calculated because CSU removes duplicate applications from the totals. In other words, the dashboard shows whether a student gained admission to the system as a whole, even if the student submitted multiple applications and some campuses denied the application. ↩︎
- The CSU application process does not ask transfer applicants to specify their preferred campus and major if they apply to multiple campuses, which limited our ability to reach precise conclusions about students’ admission preferences. Additionally, only four campuses allow all applicants to select an alternate major on their application. ↩︎
- In 2014 state law required CSU to develop a redirection process for eligible applicants with ADTs who are not admitted to the campuses to which they applied. In June 2017, state law mandated CSU to establish a policy to also redirect eligible applicants without ADTs who were not admitted to the campuses or programs to which they applied, which CSU implemented in 2019. ↩︎
- UC’s dashboard numbers differ from the campus‑specific admission rates we calculated because UC removes duplicate applications from the totals. In other words, the dashboard shows whether a student gained admission to the system as a whole, even if multiple campuses denied the application. ↩︎
- According to UC’s Multi‑Year Compact Annual Report from November 2023, the State agreed that UC should prioritize increasing its enrollment over meeting its transfer representation goal. However, monitoring transfer representation and looking for opportunities to enroll additional qualified transfer students where feasible, as we recommend later—especially when campuses or majors have more than enough qualified transfer applicants—could help the UC Office of the President meet its transfer representation goal while also increasing its overall enrollment. ↩︎
- UC Berkeley distinguished between residents and nonresidents in the college‑specific enrollment targets we reviewed but not in the major‑specific targets. ↩︎
- Throughout this report, we use the phrase accepts the ADT to mean that a CSU campus has determined that a particular transfer model curriculum for the ADT is similar to one or more of its majors or concentrations. ↩︎
- State law also requires that on or before December 31, 2024, the ADT Intersegmental Implementation Committee develop a plan for the periodic analysis and creation of additional transfer model curricula for the ADT to respond to evolving workforce demands, including STEM degree pathways. ↩︎
- As of August 2024, the Legislature has passed, but the Governor has not yet signed, a bill that would implement this recommendation by authorizing the adoption of certain STEM ADTs that contain up to 66 units of lower division coursework, when supported by clear evidence and rationale. ↩︎
- State law requires the ADT Intersegmental Implementation Committee to establish reporting deadlines before January 2025 for CSU campuses’ decisions about whether to accept ADTs. Although the committee has discussed a requirement for a CSU campus to provide a rationale if it removes its acceptance of an ADT, as of August 2024 it had not issued any formal recommendations on this topic. ↩︎
- Santa Ana completed this effort in 2021. According to Santa Ana’s dean of counseling, it conducted this process again in Fall 2023, but its efforts were still in progress when we conducted our audit work. ↩︎
