
2023-107 Proposition 47 in Riverside and San Bernardino Counties
The Number of Individuals With Four or More Convictions Increased, as Did Theft Convictions Among the Same Group
Published: July 25, 2024Report Number: 2023-107
July 25, 2024
2023‑107
The Governor of California
President pro Tempore of the Senate
Speaker of the Assembly
State Capitol
Sacramento, California 95814
Dear Governor and Legislative Leaders:
As directed by the Joint Legislative Audit Committee, my office conducted an audit of the effects of Proposition 47 in San Bernardino and Riverside counties. Our assessment focused on a selection of three law enforcement agencies from the two counties and a review of two statistically valid samples of individuals convicted of offenses that were later reclassified by Proposition 47 offenses—one from 2011 and one from 2016. Our statistical analyses were limited to the jurisdictions of these three law enforcement agencies.
We reviewed three indicators—public calls for service, law enforcement response times, and arrests—to assess the impact that Proposition 47 had on San Bernardino and Riverside counties. We did not identify any conclusive trends in calls for service or response times. However, we found that all three agencies arrested fewer individuals for Proposition 47 offenses—between 30 percent and 67 percent fewer—in the period following the implementation of the proposition.
An analysis of our samples indicates that rates of recidivism—conviction of a new felony or misdemeanor committed within three years of a previous conviction—in the two counties generally decreased after the implementation of Proposition 47. However, the number of individuals who were convicted four or more times increased by 12 percentage points. In addition, theft convictions among those who reoffended four or more times increased by 14 percentage points after the implementation of Proposition 47. The law enforcement agencies we reviewed asserted that reduced sentences are driving the increase in individuals committing multiple offenses in general and multiple theft offenses in particular.
We also found that Proposition 47 is likely fulfilling one of its intended purposes by contributing to reducing the length of incarceration for those who have committed certain nonviolent crimes. An analysis of our samples shows that the average sentence length for Proposition 47 offenses decreased by more than 40 percent after the proposition’s implementation. We recommend that the Legislature consider the adoption of either or both of the following policy mechanisms: appropriating additional funds for services that eliminate the root causes of recidivism or increasing penalties for individuals who are convicted of four or more repeat offenses.
Respectfully submitted,
GRANT PARKS
California State Auditor
Selected Abbreviations Used in This Report
| ACLU | American Civil Liberties Union |
| BSCC | Board of State and Community Corrections |
| CAD | computer-aided dispatch |
| CDCR | California Department of Corrections and Rehabilitation |
| CDI | California Department of Insurance |
| DOJ | Department of Justice |
| Riverside DA | Riverside County District Attorney’s Office |
| RMS | record management system |
Summary
Key Findings and Recommendations
In 2014 California voters approved the Safe Neighborhoods and Schools Act (Proposition 47) to ensure that the State would focus its prison spending on violent and serious offenses; to maximize alternatives other than incarceration for nonviolent crime; and to create savings that the State could invest in victim services, prevention and support programs, and mental health and drug treatment. To achieve these goals, Proposition 47 reclassified certain theft, burglary, forgery, and drug possession offenses (referred to in this report as Proposition 47 offenses), from potential felonies to misdemeanors. The Joint Legislative Audit Committee (Audit Committee) requested the California State Auditor to conduct an audit of the effects of Proposition 47 in San Bernardino and Riverside counties. The audit, as requested, was limited in scope to the two counties, and the results of our analysis should not be projected statewide. To address our audit objectives, we reviewed a selection of three law enforcement agencies from San Bernardino and Riverside counties and reviewed two statistically valid samples of individuals convicted of offenses that were later reclassified by Proposition 47—one from 2011 and one from 2016.
Our review found the following:
- We reviewed three indicators—public calls for service, law enforcement response times, and arrests—to assess the impact that Proposition 47 had on San Bernardino and Riverside counties. For the three law enforcement agencies we reviewed, we did not identify any conclusive trends in calls for service or response times either before or after the implementation of Proposition 47. However, we found that all three agencies arrested fewer individuals for Proposition 47 offenses in the period following the implementation of the proposition. Specifically, our analysis of data from the three law enforcement agencies found that following the implementation of the proposition, arrests for Proposition 47 offenses declined between 30 and 67 percent, and arrests for all other offenses declined between 15 and 29 percent depending on the agency.
- An analysis of two sample groups of individuals, one group convicted in 2011 (prior to Proposition 47) and another group in 2016 (after Proposition 47), indicates that rates of recidivism—conviction of a new felony or misdemeanor committed within three years of a previous conviction—in the two counties generally decreased slightly after the implementation of Proposition 47. We refer to recidivism throughout the report as reoffense. However, the number of individuals who were convicted four or more times increased by 12 percentage points. In addition, theft convictions among those who reoffended four or more times increased by 14 percentage points after the implementation of Proposition 47. The law enforcement agencies we reviewed asserted that reduced sentences are driving the increase in individuals committing multiple offenses in general and multiple theft offenses in particular.
- Proposition 47 is likely fulfilling one of its intended purposes by contributing to reducing the length of incarceration for certain nonviolent crimes. An analysis of our two sample groups shows that the average sentence length for Proposition 47 offenses decreased by more than 40 percent after the proposition’s implementation. In addition, according to stakeholder groups advocating for reforms to the criminal justice system, programs funded by Proposition 47 savings have decreased recidivism, homelessness, and unemployment among participants.
Therefore, we recommend that the Legislature consider the adoption of either or both of the following policy mechanisms: appropriating additional funds for services that eliminate the root causes of recidivism and/or increasing penalties for individuals who are convicted of four or more repeat offenses.
Agency Comments
Because we did not make recommendations to the three law enforcement agencies we reviewed, we did not expect to receive written responses from them; however, we did receive a response from the Riverside County Sheriff’s Office. It disagreed with and mischaracterized some of our findings and conclusions. We excluded the San Bernardino County Sheriff’s Department—the county’s largest law enforcement agency—from our audit because the department experienced a ransomware attack in the spring of 2023 that rendered much of its data unavailable.
Introduction
Background
In 2014 California voters approved the Safe Neighborhoods and Schools Act (Proposition 47) to ensure that the State would focus its prison spending on violent and serious offenses; to maximize the use of alternatives other than prison for nonserious, nonviolent crime; and to invest the savings realized as a result of the proposition into victim services, prevention and support programs in K–12 schools, and mental health and drug treatment. The text box describes the main provisions of Proposition 47.
Proposition 47 Made Three Major Changes
- It reclassified certain nonviolent offenses as misdemeanors instead of felonies or wobblers (a term commonly used to describe a crime that can be charged as either a felony or a misdemeanor). These reclassified offenses include certain types of theft and drug possession unless the defendant has prior convictions for certain violent or serious crimes.
- It authorized courts to resentence with misdemeanors those individuals who were serving felony sentences for certain nonviolent offenses. For these individuals, Proposition 47 required a thorough review of criminal history and a risk assessment to ensure that these individuals did not pose a risk to public safety. Proposition 47 also authorized courts to resentence individuals who had already served a felony sentence for a Proposition 47 offense to designate that offense as a misdemeanor.
- It created the Safe Neighborhoods and Schools Fund that allocates funds saved from the implementation of Proposition 47 to mental health and substance abuse treatment programs, support programs aimed at improving outcomes for public school students, and recovery services for crime victims.
Source: State law.
Proposition 47’s Reclassification of Offenses
Proposition 47 reclassified certain theft, burglary, forgery and drug possession offenses, which we refer to as Proposition 47 offenses, from felonies and wobblers—a term commonly used to describe a crime that can be charged as either a felony or a misdemeanor–to misdemeanors. Felonies are crimes that are punishable by death, imprisonment in state prison, or imprisonment in a county jail for more than a year. Misdemeanors are all other crimes except infractions.1 The penalties for misdemeanors are generally imprisonment in county jail, fines, or both. A sentence of imprisonment for misdemeanors is generally no more than 6 months in county jail but can sometimes be up to a year.
Before Proposition 47, individuals who committed offenses that were later reclassified by Proposition 47 could receive felony punishments for those offenses. Such individuals now generally receive misdemeanor punishments. Throughout this report, we separate Proposition 47 offenses into four categories: burglary, theft, drug possession, and forgery.2 We categorized burglary and theft separately for the reasons we describe in the text box. Figure 1 provides examples of offenses that Proposition 47 reclassified.
The Definition of Burglary Versus the Definition of Theft
Burglary is generally defined as:
- Any person who enters certain enclosures such as a house or commercial establishment with the intent to commit theft or certain other offenses, such as arson or assault with a deadly weapon, is guilty of burglary.
Prior to Proposition 47, burglary included:
- Entering a commercial establishment with the intent to commit theft of property whose value does not exceed $950.
Proposition 47 defined this type of burglary as shoplifting and established it as a new misdemeanor crime.
Because shoplifting as it became defined is not a type of burglary, and is similar to theft, we classify shoplifting as theft in our Proposition 47 analysis. All other burglary crimes remained categorized as burglary.
Source: State law.
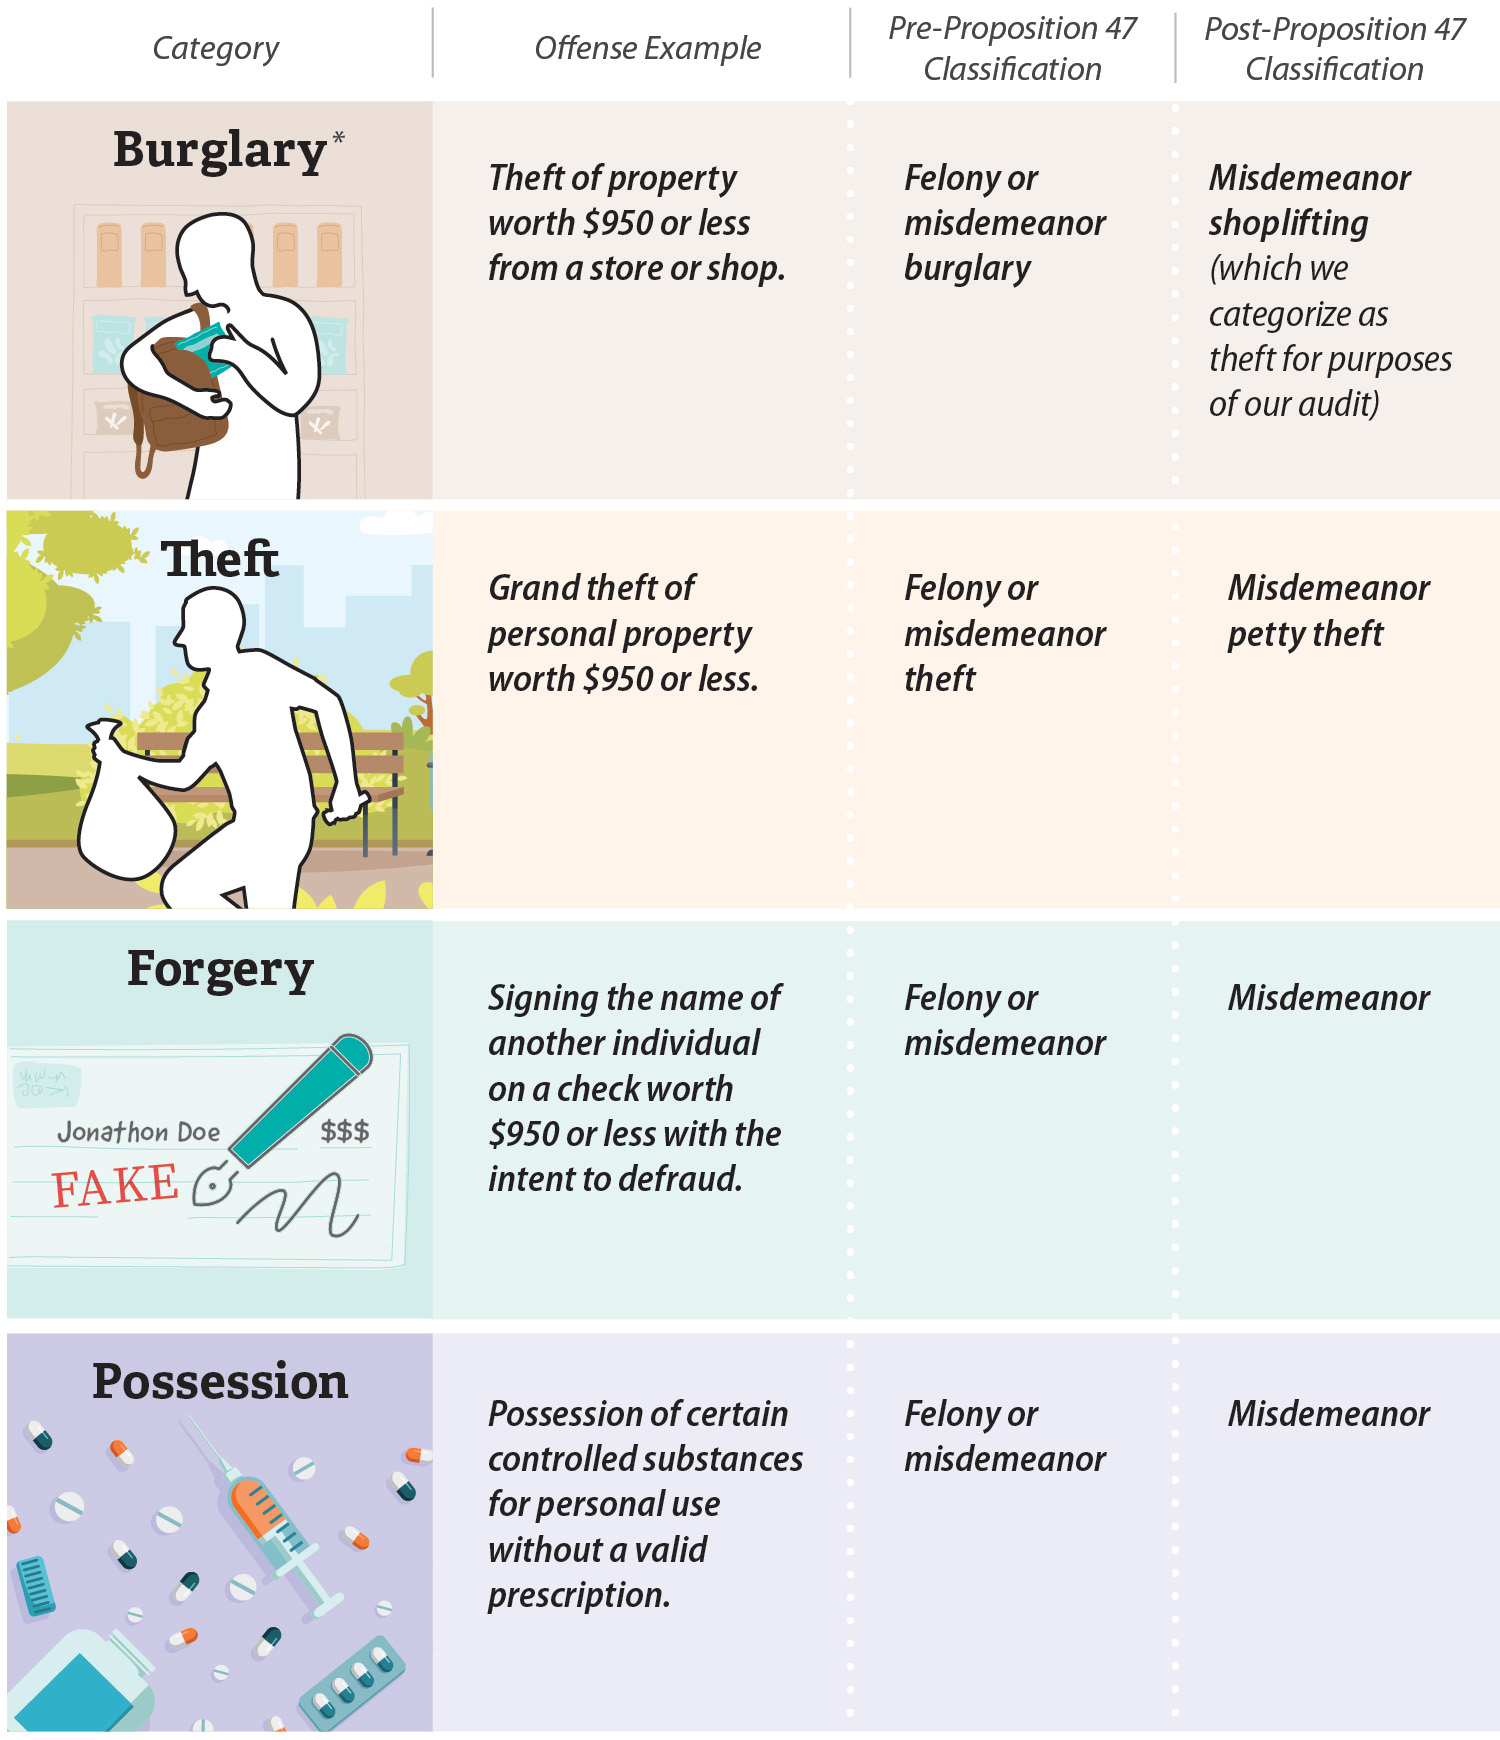
Figure 1
Examples of Offenses That Proposition 47 Reclassified
Source: State law.
Note: The figure provides examples of reclassified offenses, not a complete list of all reclassified offenses. In addition, if an individual who has previously been convicted of certain severe crimes, such as murder, commits a Proposition 47 offense, that new offense may still be charged as a felony.
* Refer to the text box titled The Definition of Burglary Versus the Definition of Theft for an explanation of why we separate the two types of offenses.
Figure 1 is a graphic depicting four categories (burglary, theft, forgery, and possession) of Proposition 47 offenses the auditors used to address the audit objectives, and provides examples of offenses in each category and their classifications both before and after the implementation of Proposition 47. The first example provided is in the burglary category and shows an image of a person committing theft of property worth 950 dollars or less from a store or shop. Before Proposition 47, this offense could be classified as either felony or misdemeanor burglary. After Proposition 47, the figure explains that this offense would generally be classified as misdemeanor shoplifting.
The second example in the figure shows a person committing grand theft of personal property worth 950 dollars or less in a park. Before Proposition 47, this offense could be classified as felony or misdemeanor theft. After Proposition 47, this offense would generally be classified as misdemeanor petty theft.
The third example in the figure is a depiction of a forged check, specifically the offense of signing the name of another individual on a check worth 950 dollars or less with the intent to defraud. Before Proposition 47, this offense could be classified as a felony or misdemeanor. After proposition 47, this offense would generally be a misdemeanor.
The fourth and final example in the figure is a depiction of the possession of certain controlled substances for personal use without a valid prescription. Before proposition 47, this offense could be classified as a felony or misdemeanor. After proposition 47, this offense could generally be classified as a misdemeanor.
The figure also has notes below it to explain that the examples provided do not represent a complete list of all offenses that Proposition 47 reclassified and that the auditors chose to make burglary and theft two separate categories based on the legal descriptions of each category.
The Safe Neighborhoods and Schools Fund
In addition to reclassifying certain crimes, Proposition 47 created the Safe Neighborhoods and Schools Fund. This fund contains the savings that accrue to the State from the implementation of Proposition 47.3 The California state controller disburses 65 percent of the fund to the California Board of State and Community Corrections (BSCC), 25 percent to the California Department of Education, and 10 percent to the Victim Compensation and Government Claims Board. The Department of Finance calculated that from fiscal years 2015–16 through 2021–22, the State saved an average of $87 million per year from the implementation of Proposition 47 for transfer to the Safe Neighborhoods and Schools Fund. All three of the agencies have reported using these funds to facilitate grant programs; the grants are meant to help fund services, such as the management of trauma recovery centers and the provision of mental health resources to people in the criminal justice system and survivors of violent crime.
Criminal Justice Processes Following the Implementation of Proposition 47
State law allows a peace officer (officer) to arrest and hold an individual suspected of a felony if the officer has probable cause. In contrast, officers generally must release individuals arrested for misdemeanors after citing—writing a notice for them to appear in court—or booking them. Thus, before the implementation of Proposition 47, a law enforcement agency could choose to hold individuals suspected of Proposition 47 offenses after booking—fingerprinting and photographing a person to record an arrest—because these offenses could be charged as felonies. Consequently, since the implementation of Proposition 47, officers have generally been required to release individuals suspected solely of committing Proposition 47 offenses. However, the officers can hold such individuals if a separate statutory reason exists to do so. For example, a statute enacted in 2022 authorizes officers to hold individuals who have been arrested or convicted of theft from a store in the previous six months or when there is probable cause to believe individuals are guilty of organized retail theft.4
Changes to State Law Have Reduced Pressures on California’s Prison and Jail Systems
Proposition 47 is one of several changes to state law that have contributed to a reduction in California’s incarcerated population. In 2011 the U.S. Supreme Court ruled that California’s prison overcrowding violated the constitutional rights of incarcerated individuals and required remedial action. Since that time, California voters have passed several propositions that have contributed to reductions to incarcerated populations, as the text box shows. For example, during fiscal year 2014–15, the California Department of Corrections and Rehabilitation (CDCR) released over 4,000 individuals who received resentencing from a court and were required to be released under Proposition 47’s provisions.
Other Propositions Contributed to Reductions in the Number of Individuals Incarcerated in California
- Proposition 36 (2012): Removed certain increases in punishment from prison sentences for certain individuals subject to the State’s existing three‑strikes law. It also allowed certain individuals serving life sentences to apply for reduced sentences.
- Proposition 57 (2016): Expanded eligibility for parole consideration; increased the State’s authority to award early release due to good behavior and rehabilitative or educational achievements; and mandated that judges, instead of prosecutors, determine whether youth should be transferred from juvenile court to criminal court for certain offenses.
- Proposition 64 (2016): Legalized specified personal use and cultivation of marijuana for adults 21 years of age or older, reduced criminal penalties for specified marijuana-related offenses for adults and youth, and authorized resentencing or dismissal and sealing of eligible marijuana-related convictions.
Source: State law.
In addition, to address overcrowding, state prisons and some county jails have at times had to release incarcerated individuals who committed nonviolent offenses. For example, since the 1990s, Riverside County has operated under a federal court order that requires the county to release individuals from its jails or refuse to accept individuals who have been recently arrested whenever all the beds in its jail system are filled, and allows the county to start refusing to accept individuals once any jail or specific housing unit has reached 90 percent of its capacity. Riverside County and other large counties in California have released incarcerated individuals because of a lack of bed capacity. Moreover, in April 2020 during the COVID-19 pandemic, the Judicial Council of California established emergency rules that included setting bail for misdemeanor and felony offenses at $0, with some exceptions. However, the Judicial Council of California rescinded these rules in June 2020.
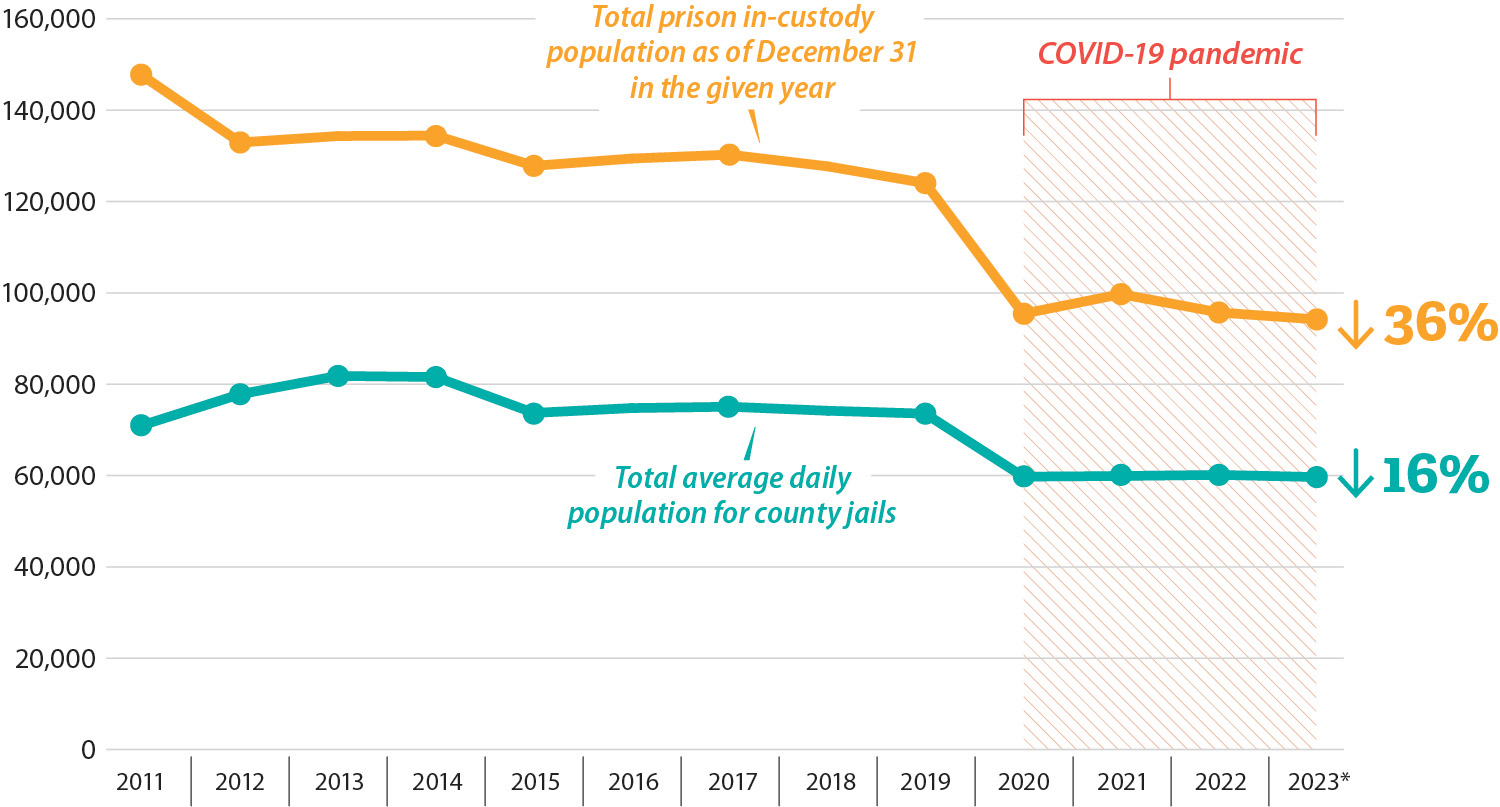
Since 2011 the numbers of individuals in state prisons and county jails have declined. We reviewed data from the CDCR and the BSCC to analyze changes in the populations of state prisons and county jails from 2011 through 2023. The factors discussed above and in the text box likely contributed to a 36 percent decline in the state prison population and a 16 percent decline in county jail populations, as Figure 2 illustrates.
Our Review of Law Enforcement Agencies in Riverside and San Bernardino Counties
The Joint Legislative Audit Committee (Audit Committee) requested that we review a selection of law enforcement agencies in San Bernardino and Riverside counties. We initially selected two sheriff’s departments and two police departments based on the number of sworn officers they employed. However, we removed the San Bernardino County Sheriff’s Department—the county’s largest law enforcement agency—from our selection during the course of the audit because the department experienced a ransomware attack in the spring of 2023 that rendered much of its data unavailable. As of May 2024, the San Bernardino County Sheriff’s Department still did not have access to some of the data that it lost because of this attack. We evaluated the data potentially available at the statewide and local law enforcement level and found that local law enforcement data contained additional information not captured in the statewide data. Therefore, we analyzed data from the three local law enforcement agencies we selected for review. The audit was limited to the three law enforcement agencies in two counties, and the results of our analysis should not be projected statewide. Table 1 shows the number of sworn officers employed by the remaining three law enforcement agencies and the populations of the communities they serve.
Figure 2
State Prison and County Jail Populations Have Declined From January 2011 Through September 2023
Source: CDCR; BSCC.
Note: The sharp decline in prison and jail populations from 2019 to 2020 coincided with the onset of the COVID-19 pandemic and related efforts, such as reducing the number of individuals in prisons and jails.
* Jail Profile Survey for 2023 data consists of data from January 2023 through September 2023.
Figure 2 is a double line graph which depicts one line for California state prison population size and one line for county jail population size from January 2011 through September 2023. State prison populations declined by 36% in that time period, and county jail populations decreased by 16% in that same time period. Both lines in the graphic show a sharp decline from 2019 to 2020, which coincided with the onset of the COVID-19 pandemic.
Audit Results
The Law Enforcement Data We Reviewed Do Not Clearly Demonstrate Whether Proposition 47 Significantly Affected Three Crime Indicators
To assess the impact of the implementation of Proposition 47 on San Bernardino and Riverside counties, we reviewed three indicators: calls for service, response times, and arrests, as Figure 3 shows. We did not identify any conclusive trends in calls for service or response times across the law enforcement agencies that demonstrate that the implementation of Proposition 47 had a significant impact on these indicators. However, we found that all three agencies arrested fewer individuals for Proposition 47 offenses in the period following the implementation of the proposition.
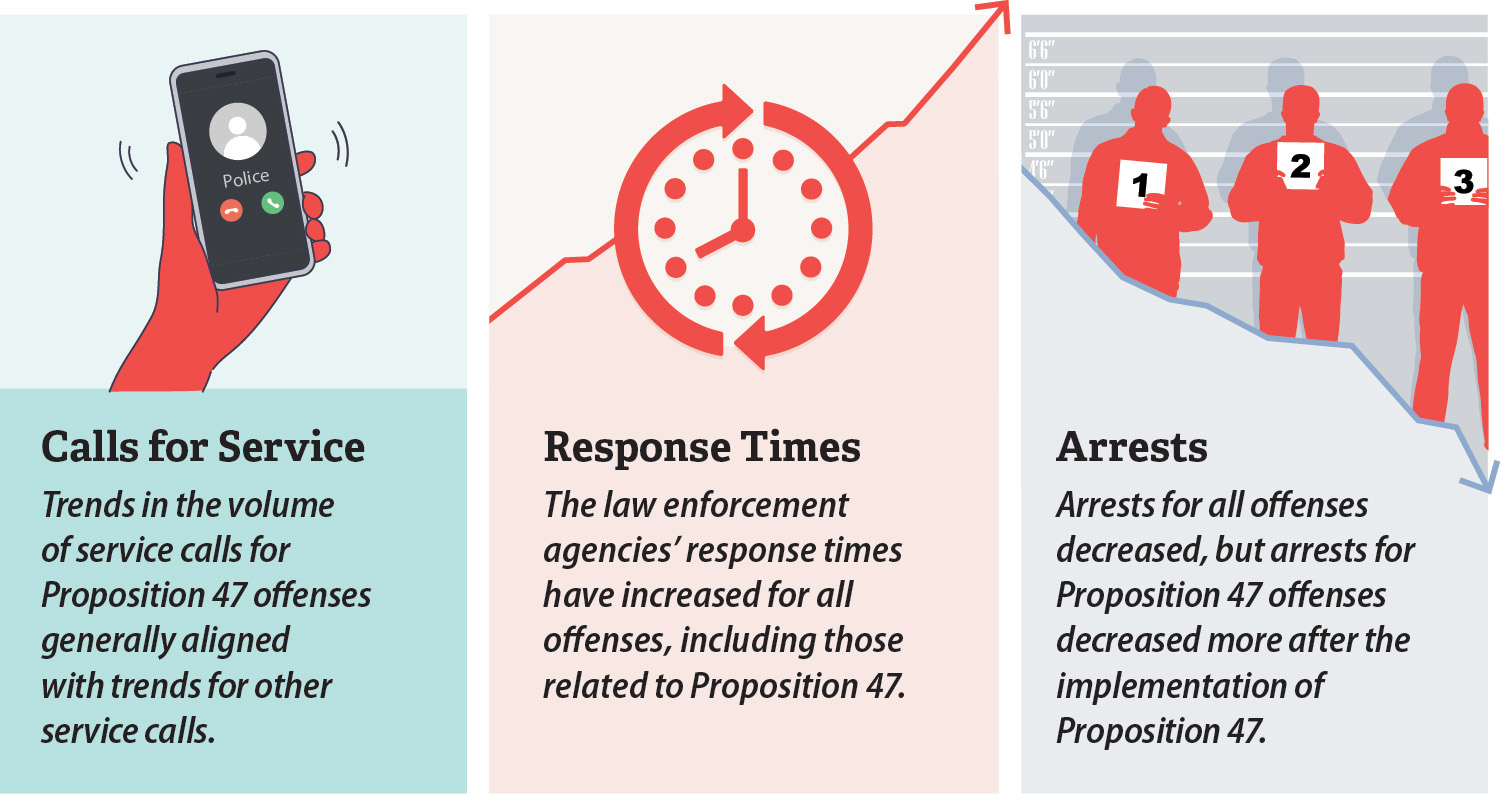
Figure 3
Proposition 47 Offenses Generally Followed Overall Trends When Compared to All Other Offenses but Showed Steeper Changes for Certain Indicators
Source: Analysis of computer-aided dispatch system and record management system data from Riverside County Sheriff’s Office, Riverside Police Department, and San Bernardino Police Department.
Figure 3 is a visual summary of the audit conclusion that proposition 47 offenses generally followed overall trends for calls for service, law enforcement response times, and arrests when compared to data for all other offenses. The figure has three parts, one describing each of the three crime indicators that the auditors reviewed. The first part on the left of the figure shows a picture of a phone call being made to the police and represents the calls for service indicator. Trends in the volume of service calls for Proposition 47 offenses generally aligned with trends for other service calls. The middle part of the figure depicts the image of a clock and represents the response times indicator. The law enforcement agencies’ response times have increased for all offenses, including those related to Proposition 47. The final part of the figure shows a police lineup of suspects and represents the arrests indicator. Arrests for all offenses decreased, but arrests for Proposition 47 offenses decreased more after the implementation of Proposition 47.
Trends in the Volume of Service Calls for Proposition 47 Offenses Have Generally Aligned With Trends for Other Service Calls
The three law enforcement agencies use computer-aided dispatch (CAD) systems to receive and log calls for service. These calls include those that the public makes to 911 or to nonemergency lines for alleged criminal activities. We have included some examples of calls for service in the text box. In addition, the CAD systems log certain other incidents, such as when an officer observes a crime in progress and reports it from the field. We compared and analyzed the three agencies’ CAD-reported activity, which we refer to as calls for service, for Proposition 47 offenses and other incidents from 2009 to 2022 for the Riverside Police Department (Riverside Police) and the Riverside County Sheriff’s Office (Riverside Sheriff) and from 2012 to 2022 for San Bernardino Police Department (San Bernardino Police).5
Examples of Service Calls
- A welfare check
- A hit-and-run
- A robbery
Source: Riverside Police, Riverside Sheriff, and San Bernardino Police CAD systems.
Calls for service for Proposition 47 offenses—including burglary, drug possession, forgery, and theft—totaled about 7 percent of all calls for service at the three law enforcement agencies during the periods we reviewed. However, the other trends we identified differed among the three agencies, as Figure 4 shows. For example, calls for service for both call types decreased slightly at Riverside Sheriff from 2014 to 2022. Meanwhile, Riverside Police experienced increases in both Proposition 47-related service calls and other service calls from 2014 to 2022. San Bernardino Police experienced an overall decrease in calls for service for both call types from 2014 through 2022; however, there was a steeper percentage drop in Proposition 47-related service calls compared to other service calls. Appendix A shows the total number of Proposition 47-related service calls for each of four categories: burglary, drug possession, forgery, and theft.
It is unclear from the data what effect, if any, Proposition 47 has had on calls for service. The three law enforcement agencies stated that the calls for service might not reflect the actual number of Proposition 47 offenses occurring because the community may be underreporting those offenses. For example, a captain at San Bernardino Police, a lieutenant at Riverside Police, and a deputy at Riverside Sheriff asserted that businesses are less likely to call the police to report thefts because even when they do so, the same individuals often return the next day to reoffend. Nevertheless, all three acknowledged that their perspective was largely based on anecdotal evidence and did not provide evidence to substantiate that it was occurring. We contacted the California Retailer’s Association to determine whether it compiles information on theft from its members. However, the association informed us it did not have any data on how frequently retailers reported thefts to law enforcement.
The Law Enforcement Agencies’ Response Times Have Increased for All Offenses, Including Those Related to Proposition 47
The three law enforcement agencies’ response times generally increased after the implementation of Proposition 47. The CAD system for each law enforcement agency logs the time it receives a call and the time that a responding officer arrives at the scene of the alleged incident. When we analyzed the three agencies’ average response times from 2014 to 2022, we found that they increased for all service calls, including those for Proposition 47 offenses, as Figure 5 shows. It is unclear from the data what effect, if any, Proposition 47 has had on response times because of other contributing factors, such as law enforcement agency staffing levels and the number of calls for service.
Figure 4
Calls for Service Trends Varied Across the Law Enforcement Agencies
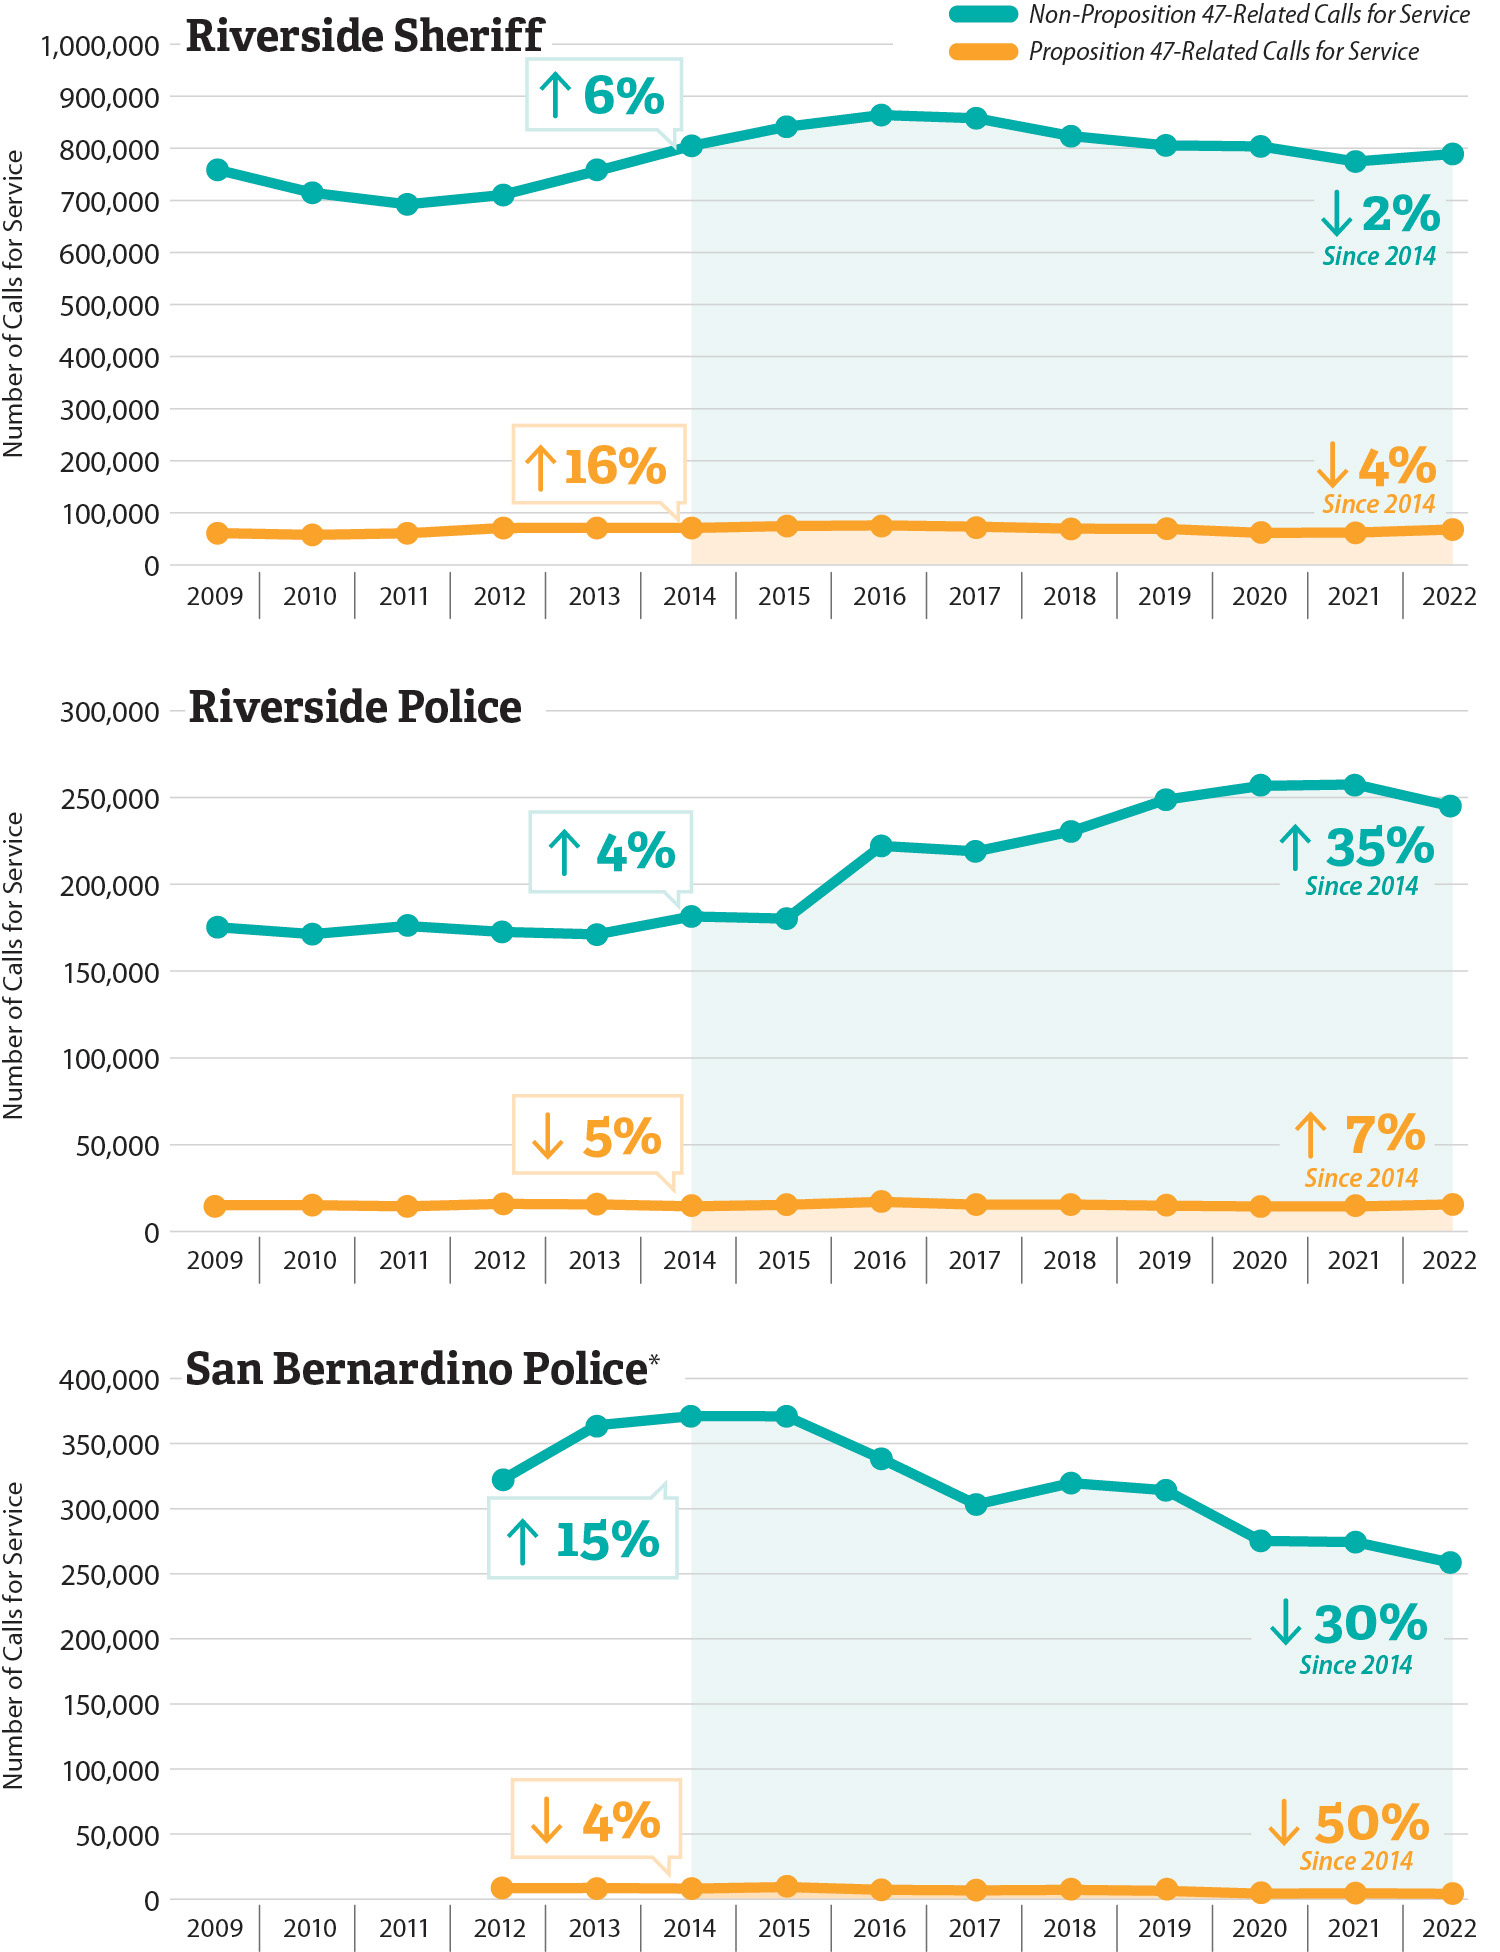
Source: Analysis of Riverside Sheriff, Riverside Police, and San Bernardino Police CAD systems.
Note: We calculated the percentage change in total calls for service before and after 2014.
* San Bernardino Police’s CAD data are only complete dating back to 2012.
Figure 4 is comprised of three graphs, one for each of the three law enforcement agencies that the auditors reviewed and they show that calls for service trends varied across the three agencies. Each graph in the figure is a double line graph, where a blue line in the graph represents data from non-Proposition 47 related calls for service and an orange line represents data from proposition 47 related calls for service.
The first graph in the figure shows data from Riverside Sheriff. Between 2009 and 2014, there was a 6 percent increase in non-Proposition 47 related calls for service, and a 16 percent increase in the proposition 47 related calls for service. Between 2014 and 2022, there was a 2 percent decrease in non-proposition 47 calls for service and a 4 percent decrease in Proposition 47 related calls.
The second graph in the figure shows data from Riverside Police. Between 2009 and 2014, there was a 4 percent increase in non-proposition 47 related calls for service, but a five percent decrease in proposition 47 related calls. Between 2014 and 2022, there was 35 percent increase in non-Proposition 47 related calls for service, and a 7 percent increase for proposition 47 related calls.
The third and final graph in figure 4 shows data from San Bernardino Police. Their graph shows data from 2012 onwards because data from prior years were incomplete. Between 2012 and 2014, there was a 15 percent increase in non-proposition 47 related calls for service, but a 4 percent decrease in proposition 47 related calls. Between 2014 and 2022, there was a 30 percent decrease in non-proposition 47 related calls for service and a 50 percent decrease in proposition 47 related calls for service.
Figure 5
Law Enforcement Agency Response Times Generally Increased for All Crimes Since 2009
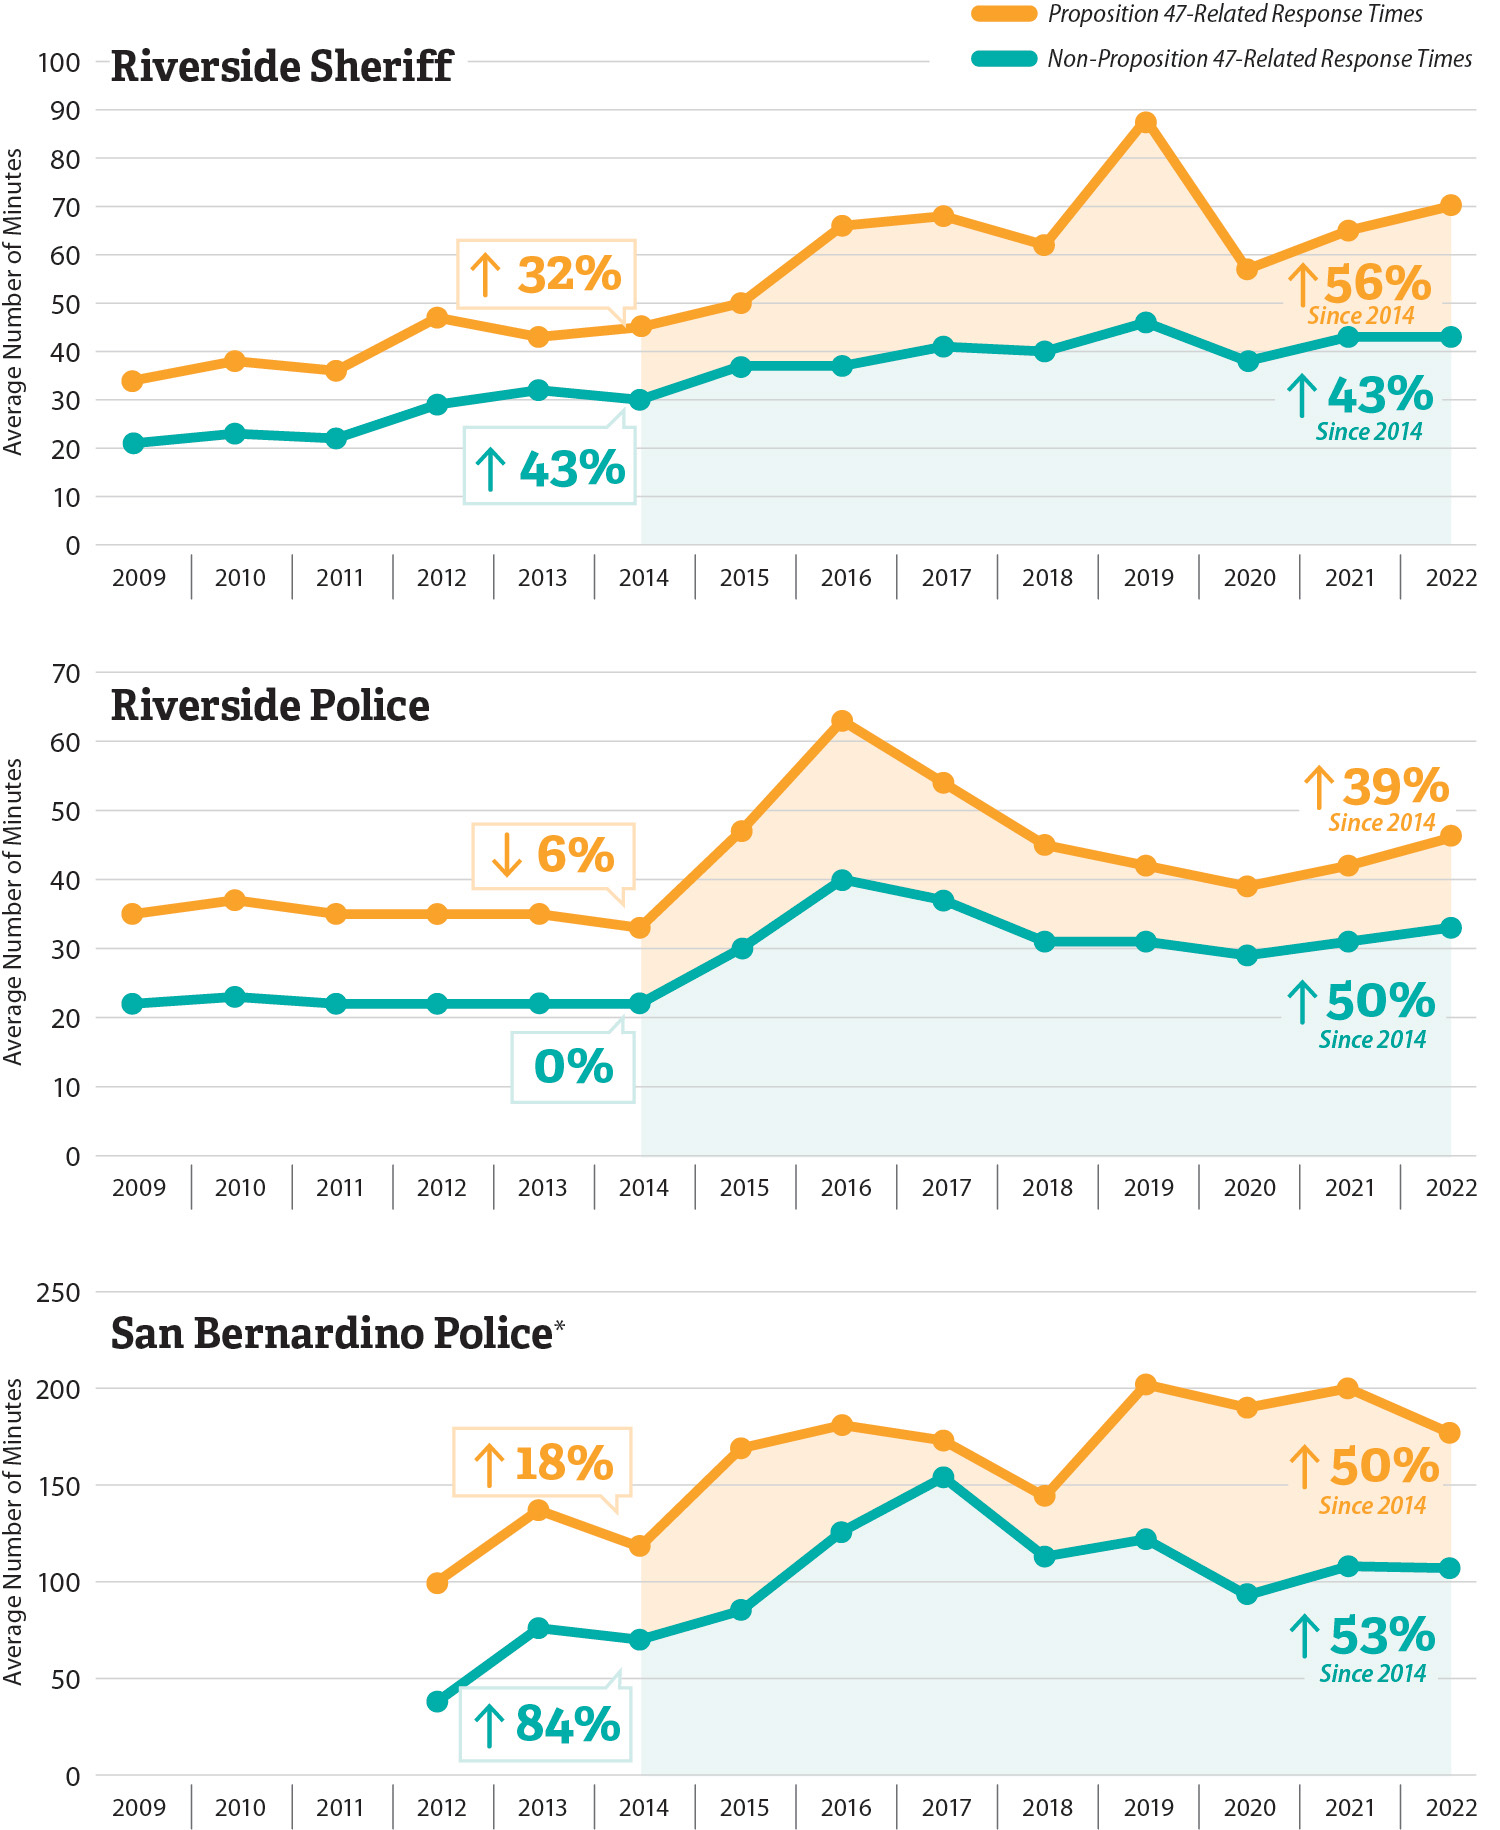
Source: Analysis of Riverside Sheriff, Riverside Police, and San Bernardino Police CAD systems.
Note: We calculated the percentage change in average response times before and after 2014.
* San Bernardino Police’s CAD data are only complete dating back to 2012.
Figure 5 is comprised of three line graphs, one for each of the three law enforcement agencies that the auditors reviewed and they show that the response times of law enforcement agencies have increased for all crimes since before the implementation of Proposition 47. Each graph in the figure is a double line graph, where a blue line in the graph represents data from non-Proposition 47 related response times and an orange line represents data from proposition 47 related response times.
The first graph in the figure shows data from Riverside Sheriff. Between 2009 and 2014, there was a 43 percent increase in non-Proposition 47 related response times, and a 32 percent increase in proposition 47 related response times. Between 2014 and 2022, there was a 43 percent increase in non-proposition 47 response times and a 56 percent increase in Proposition 47 response times.
The second graph in the figure shows data from Riverside Police. Between 2009 and 2014, there was a zero percent change in non-proposition 47 related response times, but a 6 percent decrease in proposition 47 related response times. Between 2014 and 2022, there was 50 percent increase in non-Proposition 47 related response times, and a 39 percent increase for proposition 47 related response times.
The third and final graph in figure 5 shows data from San Bernardino Police. Their graph shows data from 2012 onwards because data from prior years were incomplete. Between 2012 and 2014, there was an 84 percent increase in non-proposition 47 related response times, and an 18 percent increase in proposition 47 related response times. Between 2014 and 2022, there was a 53 percent increase in non-proposition 47 related response times and a 50 percent increase in proposition 47 related response times.
Riverside Police and San Bernardino Police explained that the increases in response times were the result of reductions in staffing levels. For example, Riverside Police cited challenges related to the recruitment and retention of officers. Research published in 2023 by the Public Policy Institute of California shows that from 2008 to 2021, Riverside and San Bernardino counties had decreases in patrol officers per 100,000 residents of 25 percent and 8 percent, respectively, which appears to corroborate the agencies’ assertions.6 In addition, as Figure 4 shows, the number of calls for service increased at Riverside Police and generally remained stable at Riverside Sheriff at the same time as the decrease in staffing, which may have affected the timeliness of their response. Riverside Sheriff explained that response time results for its department could be skewed by reclassifying crimes after a deputy arrives on the scene. Riverside Sheriff uses a tiered priority system to rank calls for service, with more serious crimes receiving highest priority and lower-level crimes receiving lower priority. A deputy may respond to a call for a higher-level crime, but then determine that a less serious crime took place and reclassify the call after investigating. Nevertheless, response times generally increased for both Proposition 47 and non-Proposition 47 related service calls and the explanation given by Riverside Sheriff would not seem to affect the trends we identified.
The Number of Arrests for Proposition 47 Offenses Has Declined
The law enforcement agencies use a record management system (RMS) to document arrests for criminal offenses. We analyzed their RMS data to determine their number of arrests, which include citations and bookings, for Proposition 47 offenses and non-Proposition 47 offenses from 2009 to 2022 for Riverside Police and Riverside Sheriff and from 2012 to 2022 for San Bernardino Police.7 We found that arrests for Proposition 47 offenses declined at all three agencies from 2014 through 2022 following the implementation of Proposition 47, as Figure 6 shows. For example, in 2014 Riverside Sheriff made 8,960 arrests for Proposition 47 offenses, while in 2022 it made 6,228 arrests for Proposition 47 offenses, a decline of 30 percent. However, prior to the implementation of Proposition 47, arrests for Proposition 47 offenses slightly increased for Riverside Police and San Bernardino Police. For Riverside Sheriff, the largest agency, arrests for Proposition 47 offenses had decreased prior to the implementation of Proposition 47. Appendix B shows the percentage change in arrest charges at the three agencies for each Proposition 47 offense category.
These decreases align with California Department of Justice (DOJ) reported trends in total arrests statewide and in Riverside and San Bernardino counties over the same period. Specifically, from 2014 through 2022, Riverside and San Bernardino counties had a decrease in all arrests of 37 percent and 28 percent respectively, and statewide levels also fell by 36 percent. Although we found a decrease in arrests that coincides with the implementation of Proposition 47, our analysis does not provide a definite causative explanation for the decrease. In 2019 the Public Policy Institute of California reported that arrest trends can be affected by factors such as economic conditions, demographics, crime rates, and the implementation of Proposition 47, among others.
Figure 6
Law Enforcement Agency Arrests for Proposition 47 Offenses Decreased Since the Implementation of Proposition 47
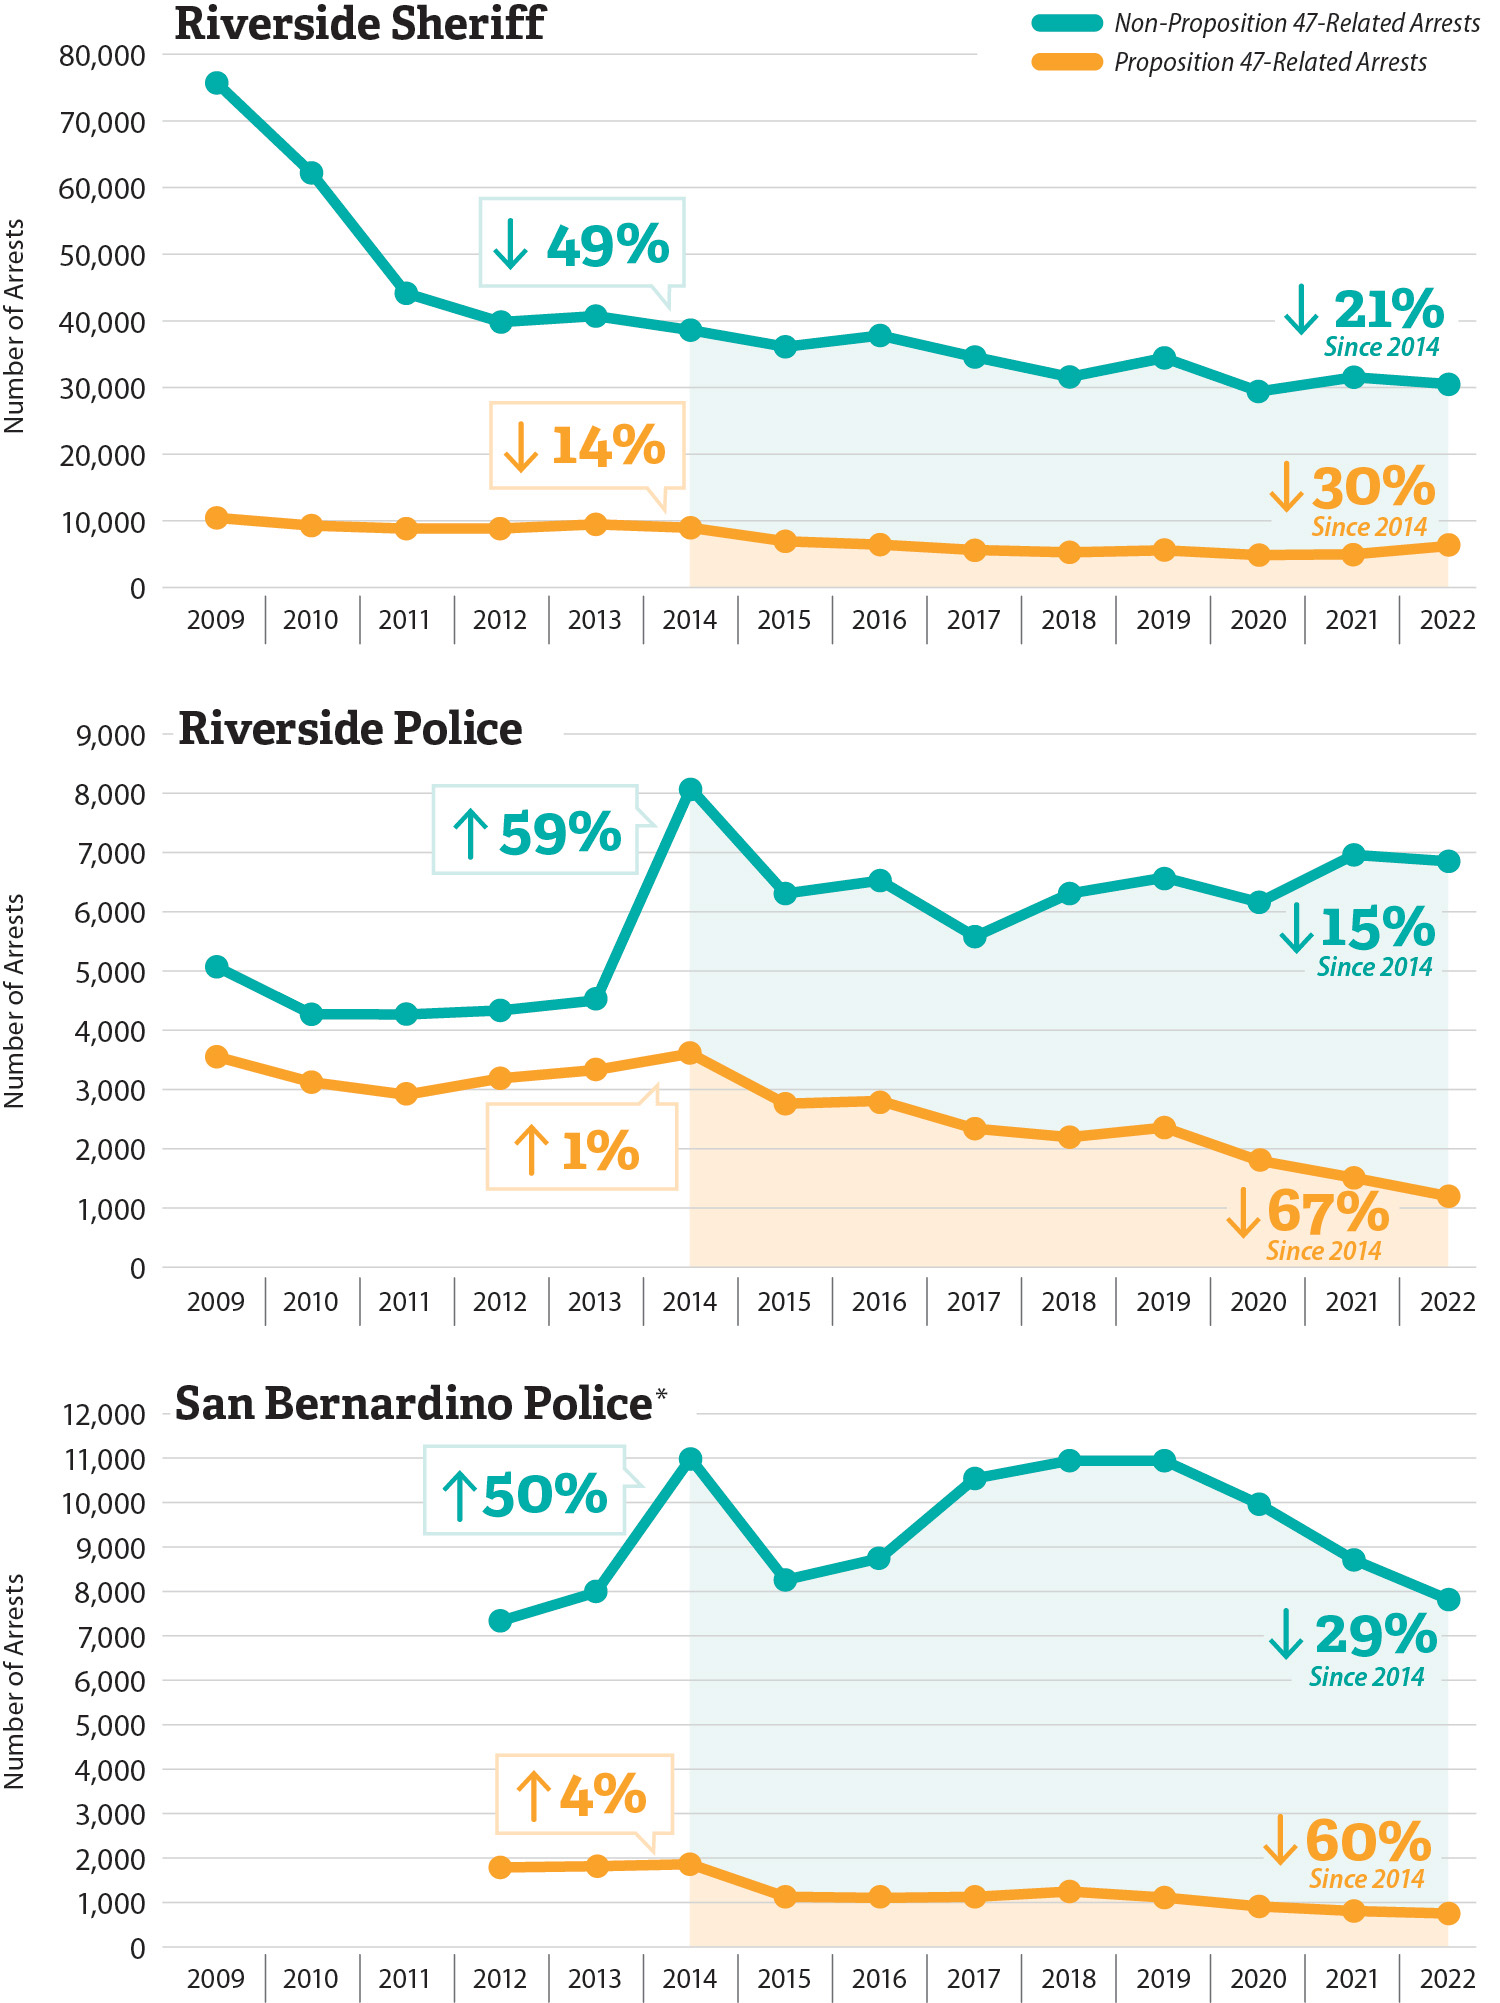
Source: Analysis of Riverside Sheriff, Riverside Police, and San Bernardino Police RMS data.
Note: We calculated the percentage change in total arrests before and after 2014.
* San Bernardino Police’s RMS data are only complete dating back to 2012.
Figure 6 is comprised of three line graphs, one for each of the three law enforcement agencies that the auditors reviewed, and they show that arrests for proposition 47 offenses decreased at all three law enforcement agencies since before the implementation of proposition 47. Each graph in the figure is a double line graph, where a blue line in the graph represents data from non-Proposition 47 related arrests and an orange line represents data from proposition 47 related arrests.
The first graph in the figure shows data from Riverside Sheriff. Between 2009 and 2014, there was a 49 percent decrease in non-Proposition 47 related arrests, and a 14 percent decrease in proposition 47 related arrests. Between 2014 and 2022, there was a 21 percent decrease in non-proposition 47 related arrests and a 30 percent decrease in Proposition 47 related arrests.
The second graph in the figure shows data from Riverside Police. Between 2009 and 2014, there was 59 percent increase in non-proposition 47 related arrests, and an 1 percent increase in proposition 47 related arrests. Between 2014 and 2022, there was a 15 percent decrease in non-Proposition 47 related arrests, and a 67 percent decrease for proposition 47 related arrests.
The third and final graph in figure 6 shows data from San Bernardino Police. Their graph shows data from 2012 onwards because data from prior years were incomplete. Between 2012 and 2014, there was a 50 percent increase in non-proposition 47 related arrests, and a 4 percent increase in proposition 47 related arrests. Between 2014 and 2022, there was a 29 percent decrease in non-proposition 47 related arrests and a 60 percent decrease in proposition 47 related arrests.
According to the agencies, there were likely a number of causes for the decline in arrests for Proposition 47 offenses. For example, a lieutenant with Riverside Police explained that businesses now often report crimes days or weeks after they occur, usually online. These delays can hinder officers’ ability to make an arrest. The assistant chief at San Bernardino Police provided a similar explanation. He also explained that many retail businesses report online after the fact for insurance purposes only. In addition to issues surrounding online reporting, the assistant chief for the San Bernardino Police stated that generally, law enforcement agencies dedicate available resources to consequential crimes that affect the community and that the implementation of Proposition 47 had a cooling effect on agencies’ devotion of scarce resources to Proposition 47 offenses. A deputy with Riverside Sheriff explained that calls for property crimes generally lack the evidence needed to conduct a thorough investigation, and that contributes to less arrests.
Following the Implementation of Proposition 47, the Number of Individuals Who Reoffended With Four or More Convictions Increased at the Three Law Enforcement Agencies We Reviewed
When we reviewed publicly available case histories and court records for a statistical sample of individuals convicted of a Proposition 47 offense in 2011 and 2016 at the three law enforcement agencies we reviewed, we found that overall rates of recidivism—conviction of a new felony or misdemeanor committed within three years of a previous conviction—declined slightly, as Figure 7 shows. We refer to recidivism throughout the report as reoffense. This decline generally aligns with CDCR’s measure of statewide recidivism for its 2011-12 group of 54 percent and its 2016–17 group of 48 percent. However, among those who reoffended in our sample at the three law enforcement agencies we reviewed, our analysis found that there were more individuals with four or more convictions, an increase of 12 percentage points, following the implementation of Proposition 47. Moreover, among this group of individuals, the frequency of theft convictions increased after the implementation of Proposition 47.
Figure 7
Although Overall Reoffense Rates Decreased at the Three Law Enforcement Agencies We Reviewed, the Number of Individuals Who Reoffended With Four or More Convictions Increased
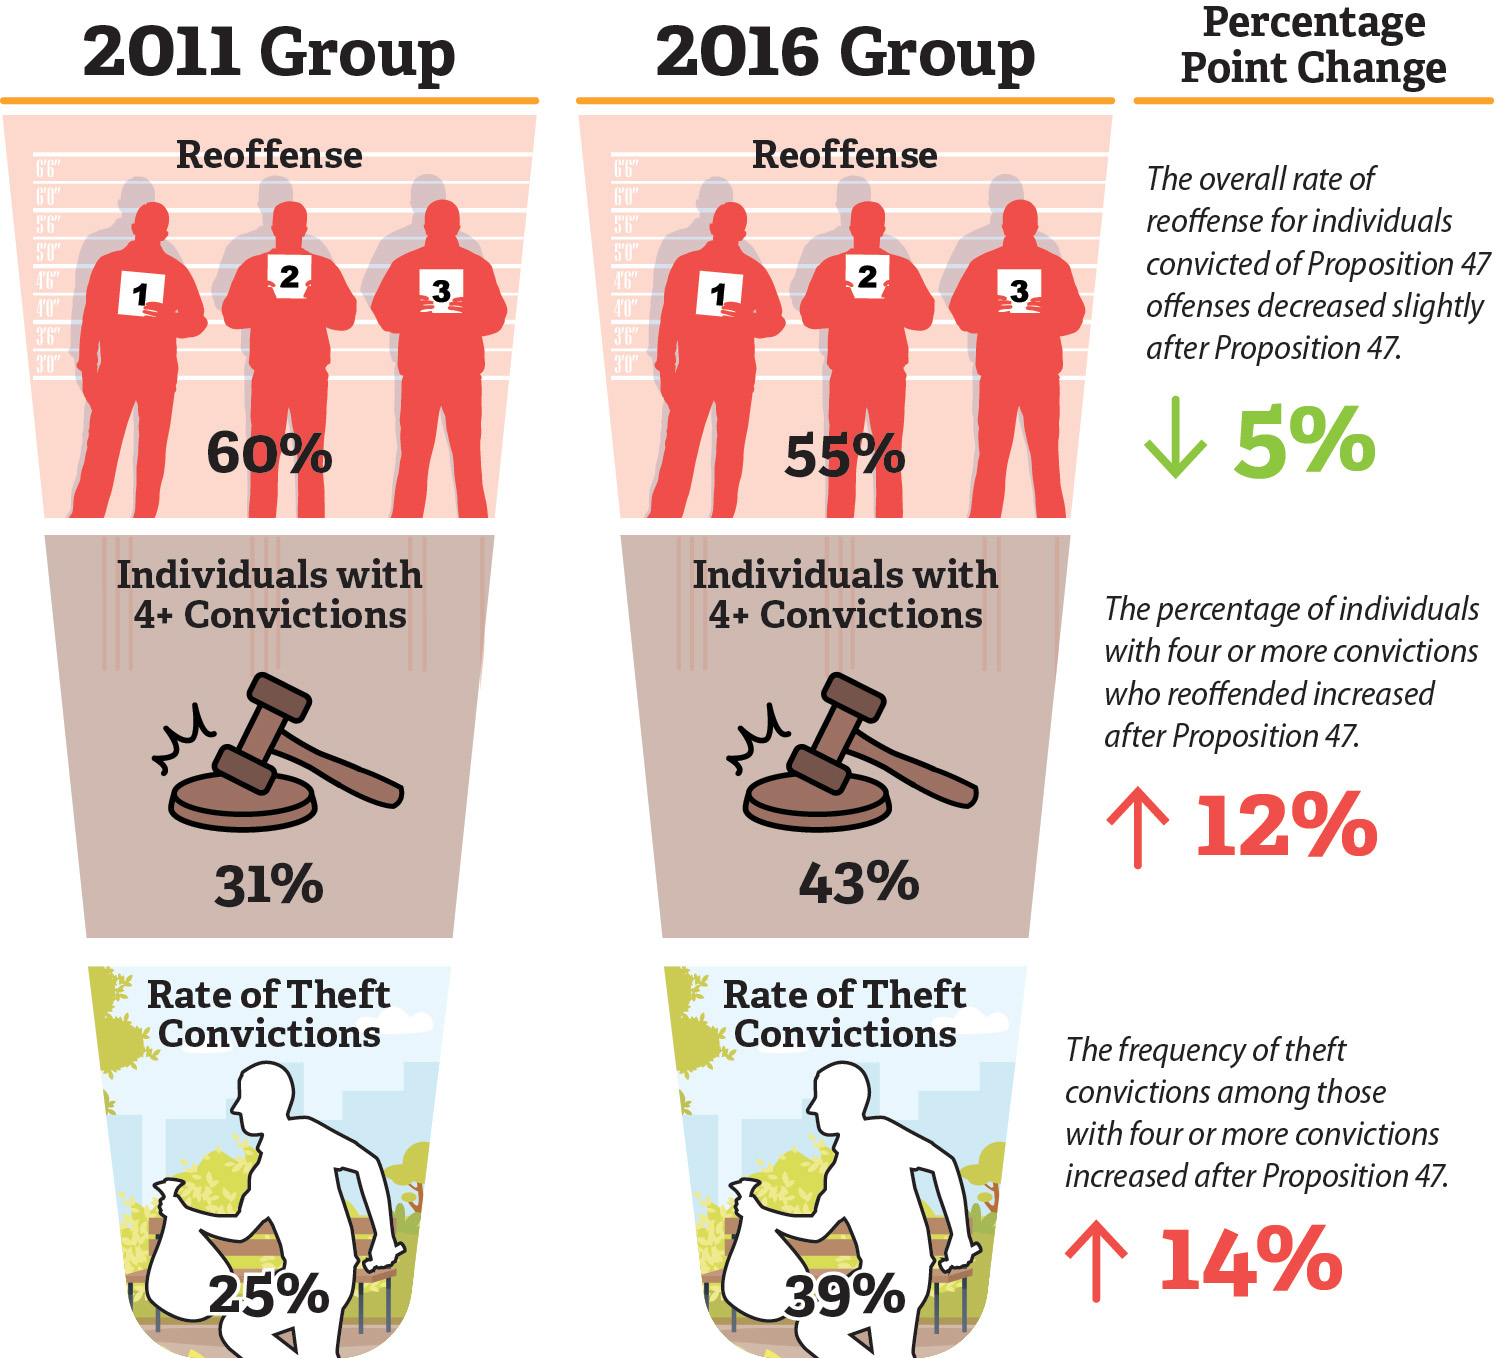
Source: DOJ; analysis of Riverside Superior Court and San Bernardino Superior Court public documents and court records.
Note: Refer to Appendix C for a description of the methodology used to select our two sample groups of individuals convicted of offenses that were later reclassified by Proposition 47 in 2011 and another group in 2016.
Figure 7 is comprised of images which summarize the auditors’ finding that based on an analysis of two sample groups, one from 2011 and one from 2016, the overall reoffense rates decreased at the three law enforcement agencies the auditors reviewed and that the number of individuals who reoffended with four or more convictions increased. This figure is divided into two main parts, one for each sample group, to compare the results from each. In the 2011 group, the overall rate of reoffense was 60 percent, where as the rate of reoffense for the 2016 group was 55 percent, which is a decrease of five percentage points. Of those who reoffended in the 2011 group, 31 percent were individuals with four or more convictions, while of those who reoffended in the 2016 group, 43 percent were individuals with four or more convictions, which is an increase of 12 percentage points. Lastly, in the 2011 group, of those who reoffended with four or more convictions, theft convictions comprised 25 percent of those reoffenses, while in the 2016 group, of those who reoffended with 4 or more convictions, theft convictions comprised 39 percent of those reoffenses, which is an increase of 14 percentage points. There is a note below the figure which also describes the selection of the sample groups; more information about the auditors’ methodology can be found in Appendix C.
The Number of Individuals Who Reoffended With Four or More Convictions Increased at the Three Law Enforcement Agencies We Reviewed After the Implementation of Proposition 47
BSCC defines recidivism as conviction for a new felony or misdemeanor committed within three years of release for a previous criminal conviction, as the text box describes. To assess the rates of reoffense before and after Proposition 47 took effect, we reviewed court records and publicly available case histories of individuals convicted of Proposition 47 offenses at the three law enforcement agencies we reviewed before and after its implementation. We then consulted with a statistician to interpret the results of our analysis.
Definition of Recidivism
Recidivism: Conviction for a new felony or misdemeanor committed within three years of release from custody or committed within three years of placement on supervision for a previous criminal conviction.
This definition excludes cases dropped or dismissed, noncriminal traffic offenses, and violations of supervision (parole, probation, mandatory supervision, etc.).
Source: BSCC.
We compared a group of randomly selected individuals arrested by one of the three law enforcement agencies we selected for review and subsequently convicted of a Proposition 47 offense in Riverside and San Bernardino counties in 2011, before the implementation of Proposition 47, to a group of randomly selected individuals who were convicted of a Proposition 47 offense in 2016, after the proposition’s implementation. Using public records from the respective county courts, we determined whether the individuals in each group reoffended within three years of their first conviction for a Proposition 47 offense and, if so, how many subsequent convictions they had within that period. We included non-Proposition 47 offenses when determining subsequent convictions. For example, someone who was convicted of a Proposition 47 offense involving drug possession might have reoffended with a conviction for a non-Proposition 47 offense, such as driving under the influence or battery. Overall, we analyzed the criminal records of 221 individuals over a three-year period. We describe the methodology we used for this analysis in detail in Appendix C.
The overall rates of reoffense in our samples before and after the implementation of Proposition 47 declined from 60 percent to 55 percent.8 However, the number of individuals in our sample with four or more convictions who reoffended increased, as Table 2 shows.9 These results suggest that although individuals who were convicted of Proposition 47 offenses generally reoffended less frequently in the later sample, a subset of this group committed more offenses. Although we identified a significant difference of 12 percentage points between the two groups among individuals with four or more convictions, we only identified slight variations—6 percentage points or less—among individuals in the two groups with less than four convictions. If we project these sample results to the population of the three law enforcement agencies’ jurisdictions, we estimate that about 232 more individuals may have reoffended with four or more convictions after the implementation of Proposition 47 than did so before its implementation.10
In an effort to substantiate our recidivism analysis, we analyzed Riverside Sheriff’s RMS to determine how many individuals it arrested four or more times in each year during the audit period. We found that the average number of individuals it arrested four or more times for Proposition 47 offenses in a year more than doubled following the implementation of Proposition 47, from 29 before Proposition 47 to 61 after Proposition 47. Although not all arrests lead to a conviction, these data support our recidivism analysis finding that a subset of individuals were convicted of committing more offenses after the implementation of Proposition 47.
The Frequency of Theft Convictions at the Three Law Enforcement Agencies We Reviewed Increased After the Implementation of Proposition 47, Particularly for Those Who Reoffended With Four or More Convictions
The frequency of theft convictions and—more specifically—of theft convictions among those who reoffended with four or more convictions increased at the three law enforcement agencies we reviewed after the implementation of Proposition 47. Theft convictions in our 2016 sample were 8 percentage points higher than theft convictions in our 2011 sample. More significantly, theft convictions among the subset of individuals who reoffended with four or more convictions rose by 14 percentage points. This increase was higher than the increases for any other Proposition 47 offense categories, as Table 3 shows.11 For example, we identified an individual in our sample who was convicted for seven theft-related offenses after the implementation of Proposition 47. This individual was convicted three times within three months and then four more times within the next three years. All of these were misdemeanor convictions.
The law enforcement agencies asserted that the reduced consequences for Proposition 47 offenses may have caused the increase in the frequency of theft cases in our samples. For example, before Proposition 47, petty theft could be punished as a felony if a person had three prior theft convictions; however, after Proposition 47, petty theft with a prior theft conviction is a misdemeanor except in very limited circumstances. A deputy with Riverside Sheriff and an assistant chief with San Bernardino Police stated that they believe Proposition 47 created an incentive for individuals to commit multiple offenses by reducing the consequences for repeat offenses. To assess whether the data indicated a decrease in sentencing length, we analyzed the average sentence length for individuals in our sample groups convicted of a Proposition 47 offense, which we discuss in the next section.
Our Review Indicates That Proposition 47 Has Achieved Some of Its Intended Purposes
When we analyzed court records to determine the average sentence length for Proposition 47 offenses in our sample population, we found that the length of sentences had decreased at the three law enforcement agencies we reviewed after the implementation of Proposition 47, in line with the law’s intended purpose. Specifically, following the law’s implementation, the average sentences individuals in our samples received for Proposition 47 offenses decreased by more than 40 percent. This drop was likely the result of reductions in sentences for theft and drug possession offenses, as Table 4 shows. Proposition 47 reclassified certain theft and drug possession offenses from felonies or wobblers to misdemeanors, the latter of which calls for shorter jail sentences.12
The Riverside County District Attorney’s Office (Riverside DA) agreed that Proposition 47 has definitely achieved its intended goal of reducing prison sentences for Proposition 47 offenses. Nevertheless, the Riverside DA attested that it believes there have been several unintended negative consequences, including an increase in organized retail theft offenses. We discuss arrests for organized retail theft later in this report.13
Organizations that advocate for reforms to the criminal justice system also provided their perspective on Proposition 47’s effects. When we spoke to entities such as the American Civil Liberties Union of Southern California (ACLU SoCal), the Ella Baker Center for Human Rights, Californians for Safety and Justice, and Legal Services for Prisoners with Children, they cited studies that have shown the positive effects Proposition 47 has had on California. For example, the BSCC performed a statewide evaluation of its Proposition 47 grant program and found that recidivism among participants enrolled in services funded by the savings associated with Proposition 47 was lower than other reported statewide recidivism estimates.14 Specifically, participants had a 15 percent rate of recidivism after enrolling in a grant program, while statewide recidivism estimates were between 35 and 45 percent.15 This BSCC study also found a 60 percent decrease in homelessness and a 50 percent decrease in unemployment among participants who received the Proposition 47-funded services and identified housing or employment as goals of their participation. In another example, the National Institute of Justice gave a Promising rating to the policy reform enacted by Proposition 47, which implies that the policy reform is achieving its intended outcomes.16
Given these and other studies, the organizations to which we spoke largely support efforts to increase the State’s investment in programs that identify and address the factors that may cause individuals to commit Proposition 47 offenses. These factors include unmet community needs, such as access to housing, employment, and programs to address mental health concerns. ACLU SoCal staff explained that they believe opportunities to address these community needs have been historically underfunded in Riverside and San Bernardino counties and constitute some of the underlying causes of why individuals may commit Proposition 47 offenses.
In addition, the organizations expressed concerns that enhancing sentencing for Proposition 47 offenses would have negative consequences. For example, they asserted that this step could remove funding for programs that have been effective at addressing unmet community needs, as we describe above. Legal Services for Prisoners with Children also emphasized that efforts to enhance sentencing for Proposition 47 offenses could actually lead to an increase in recidivism rates because the collateral consequences associated with individuals receiving felony convictions—including substantial barriers to accessing housing, employment, and education—could negatively reinforce the underlying causes of why people commit crimes.
California Has Several Options for Addressing the Increases in Multiple Reoffenses and Theft
As we previously explain, our analysis identified an increase among those who reoffended with four or more convictions after the implementation of Proposition 47 at the three law enforcement agencies we reviewed. We also found an increase in the frequency of theft convictions, particularly for individuals with four or more convictions. To address the issues that we observed, the Legislature may want to consider changes to the laws impacted by Proposition 47.
During the 2023–24 legislative session, state legislators introduced multiple pieces of legislation related to Proposition 47 offenses. One option these bills have proposed is increasing penalties for individuals convicted of multiple Proposition 47 offenses. We provide an example of some code sections that could be considered for such a legislative change in Table 5. A second option the bills identify is expanding theft diversion programs that allow individuals to enter treatment programs in lieu of receiving jail sentences.
Proposition 47 can be amended by a two-thirds vote of the members of each house of the Legislature and signature by the Governor but only if the amendments are consistent with, and further the intent of, the proposition. Alternatively, the Legislature could also enact a proposal to amend Proposition 47; however, the proposed amendment would not become effective until submitted to and approved by the voters. This alternative process is required if the amendment is not consistent with or does not further the intent of the proposition. Further, the people may introduce ballot initiatives that amend or repeal Proposition 47. For example, ballot initiative 23-0017A1 is qualified for the statewide November 2024 general election. If the voters adopt it, this initiative would, among other things, make a third conviction for petty theft and shoplifting a potential felony.
Our audit was limited to the three law enforcement agencies in two counties, and the results of our analysis are not intended to be projected statewide. Although our analysis showed an increase in the frequency of theft convictions among those who reoffended with four or more convictions after the implementation of Proposition 47, our analysis shows a correlation, but does not provide an explanation for the cause of this increase. Nevertheless, we also considered interviews with law enforcement agencies and other stakeholder groups, along with the external studies we discussed previously, to ultimately inform the policy options listed below for the Legislature to consider.
Recommendations
If the Legislature decides that it wants to take action to reduce the likelihood that individuals with multiple convictions will continue to engage in theft, the Legislature could consider the adoption of either or both of the following policy mechanisms:
- Appropriating funds for programs and services to address what it determines to be the root causes of recidivism. In particular, it may want to identify and provide funding to the types of programs and services that recent studies have identified as effective in reducing recidivism.
- Either by enacting legislation that is consistent with and furthers the intent of Proposition 47, or by enacting a proposal for approval by the voters that would amend Proposition 47, to allow more severe punishment for those convicted multiple times of theft, likely by identifying such offenses as potential felonies instead of automatically classifying them as misdemeanors.
Other Areas Reviewed
The Law Enforcement Agencies We Reviewed Did Not Make Significant Changes to Their Policies as a Result of the COVID-19 Pandemic
The Audit Committee requested that we identify public safety policy changes in San Bernardino and Riverside counties that resulted from the COVID-19 pandemic and that we determine whether those policy changes affected the level of criminal activity. We found that the three law enforcement agencies generally did not make any policy or procedural changes to their normal operations as a result of the pandemic, other than requiring notices for COVID-19 exposures. According to the agencies, the pandemic did not result in any formally documented changes to department policies and enforcement procedures except for some logistical changes to reduce potential exposure to the virus. Thus, we did not identify substantive policy changes at the three agencies that affected criminal activity in Riverside and San Bernardino counties. Nevertheless, as we discuss in the Introduction, statewide $0 bail rules implemented during the pandemic may have affected incarceration levels.
Organized Retail Theft From 2019 to 2022
Over the past six years, the Legislature has passed several pieces of legislation to combat organized retail theft, an offense that became effective in 2019, several years after the implementation of Proposition 47 in 2014. We summarize some of the key components of this legislation in the text box. Data from the selected law enforcement agencies show that of the nearly 222,000 arrests they made from 2019 to 2022, 33 included arrest charges with penal code provisions for organized retail theft. According to officers at San Bernardino Police and Riverside Sheriff, one explanation for the seemingly small number of arrests for organized retail theft is that officers may arrest individuals who have allegedly committed organized retail theft offenses under penal code sections that are not specifically labeled as “organized retail theft.” Riverside DA offered that a reason there are relatively few arrests for organized retail theft could be related to underreporting of theft‑related crimes. Riverside Sheriff also explained that the California Highway Patrol received state funding to address organized retail theft. Therefore, the arrest figures from the three law enforcement agencies may not represent the total number of organized retail theft arrests made in Riverside and San Bernardino counties. However, this was an audit specifically of Proposition 47’s effects in the two counties and the penal code provisions for organized retail theft we analyzed were enacted years after the implementation of Proposition 47. Ultimately, as we note, our analysis found the frequency of theft convictions and—more specifically—of theft convictions among those who reoffended with four or more convictions increased after the implementation of Proposition 47, and we provide recommendations to the Legislature to address this issue.
Key Components of Recent Legislation to Address Organized Retail Theft
- Defined organized retail theft to include the commission of acts in concert with one or more persons to steal, receive, purchase, or knowingly possess merchandise taken from a merchant’s premises or online marketplace.
- Enables the prosecution of individuals who commit acts of organized retail theft. Prosecutors can consider the aggregated value of stolen merchandise over a 12-month period when charging an individual with organized retail theft.
- Extended the jurisdiction, and altered the subsequent prosecution, of a criminal action for theft to include the county where an offense involving the theft or receipt of the stolen merchandise occurred, the county in which the merchandise was recovered, or the county where any act was done by the defendant in instigating, procuring, promoting, or aiding in the commission of a theft offense.
- Enabled officers to hold a person following a misdemeanor arrest if the officers have probable cause to believe the person is guilty of committing organized retail theft.
- Mandated the California Highway Patrol to convene a regional property crimes task force to assist local law enforcement in counties with elevated levels of property crime.
Source: State law.
We conducted this performance audit in accordance with generally accepted government auditing standards and under the authority vested in the California State Auditor by Government Code section 8543 et seq. Those standards require that we plan and perform the audit to obtain sufficient, appropriate evidence to provide a reasonable basis for our findings and conclusions, based on the audit objectives. We believe that the evidence obtained provides a reasonable basis for our findings and conclusions, based on our audit objectives.
Respectfully submitted,
GRANT PARKS
California State Auditor
July 25, 2024
Staff:
Nicholas Kolitsos, CPA, Audit Principal
Aaron Fellner, Senior Auditor
Eduardo Moncada
Kaleb Knoblauch
Myra Farooqi
Ashley Yan
Data Analytics:
R. Wade Fry, MPA
Shauna M. Pellman, MPPA, CIA
Sarah Rachael Black, MBA, CISA
Legal Counsel:
Joe Porche
Appendices
Appendix A — Volume of Service Calls for Alleged Proposition 47 Offenses by Crime Category
Appendix B — Number of Arrest Charges at Each Law Enforcement Agency for Alleged Proposition 47 Offenses by Crime Category
Appendix C—Recidivism Methodology
Appendix D—Scope and Methodology
Appendix A
Volume of Service Calls for Alleged Proposition 47 Offenses by Crime Category
Table A shows the volume of alleged Proposition 47-related service calls made to each of the three law enforcement agencies we selected for review. The table separates the calls by the categories of the alleged offenses: burglary, drug possession, forgery, and theft.
Appendix B
Number of Arrest Charges at Each Law Enforcement Agency for Alleged Proposition 47 Offenses by Crime Category
Table B shows the number of arrest charges for alleged Proposition 47 offenses at the three law enforcement agencies we selected for review. The table separates the arrest charges by category. An individual might be arrested on multiple charges. The decreases in arrests, which we discuss in the Audit Results, correspond with the decreases in arrest charges, but because multiple arrest charges may be combined in a single arrest, the table will not reconcile to Figure 6.
Appendix C
Recidivism Methodology
The Audit Committee directed us to assess the rates of recidivism in San Bernardino and Riverside counties for individuals following their convictions for Proposition 47 offenses before and after the proposition took effect. We consulted with a statistician to use data from the DOJ to select statistically valid sample for two cohorts—one in 2011 and one in 2016—across the three law enforcement agencies. This allowed us to project to the population of individuals convicted of a Proposition 47 offense for the jurisdictions of the three law enforcement agencies in the two counties.
Our samples consisted of 227 total offenders divided into the two cohorts, as Figure C describes. To measure reoffense rates before the implementation of Proposition 47 in November 2014, we randomly selected from the three law enforcement agencies a proportional sample of 113 individuals who were convicted of a Proposition 47 offense in 2011.17 To measure reoffense rates after the implementation of Proposition 47 and to allow the changes to law some time to take effect, we also randomly selected from the three law enforcement agencies a proportional sample of 114 individuals who were convicted of a Proposition 47 offense in 2016. The availability of data affected the size of our samples. In some cases, the smaller sample sizes had minimal impact on the precision of the results.
We developed our analysis based on the BSCC’s definition of recidivism: a conviction of a new felony or misdemeanor committed within three years of release from custody or within three years of placement on supervision for a previous criminal conviction. According to this definition, “a new felony or misdemeanor” excludes cases dropped or dismissed; noncriminal traffic offenses, regardless of guilt; new jail admissions; and violations of supervision (parole, probation, mandatory supervision, or other terms of release). We reviewed publicly available case histories and court records provided by Riverside and San Bernardino county superior courts to determine whether individuals in the samples were convicted of offenses within three years of their first conviction. Additionally, we reviewed DOJ records for offenses so that we could include any offenses committed outside of the county where the individual was first convicted. We analyzed these results to determine the rates of reoffense before and after Proposition 47.
We determined whether the sampled individuals reoffended within three years of their first conviction. We consulted with a statistician to determine whether our results were statistically significant. The statistician ran tests at 90 percent, 85 percent, and 80 percent confidence levels for our results to determine statistical significance. For much of our analysis, we assessed our results in terms of statistical significance using preset confidence levels. Statistical significance is a test commonly used to determine whether the results derived from analysis of a sample could be caused by chance and the extent to which we can draw conclusions on the total population. For example, for a sample with an 80 percent confidence level, we would generally have an 80 percent certainty that the population’s true results would be reflected in the sample’s results.
Figure C
Our Selection Methodology for Determining Recidivism at the Three Law Enforcement Agencies We Reviewed
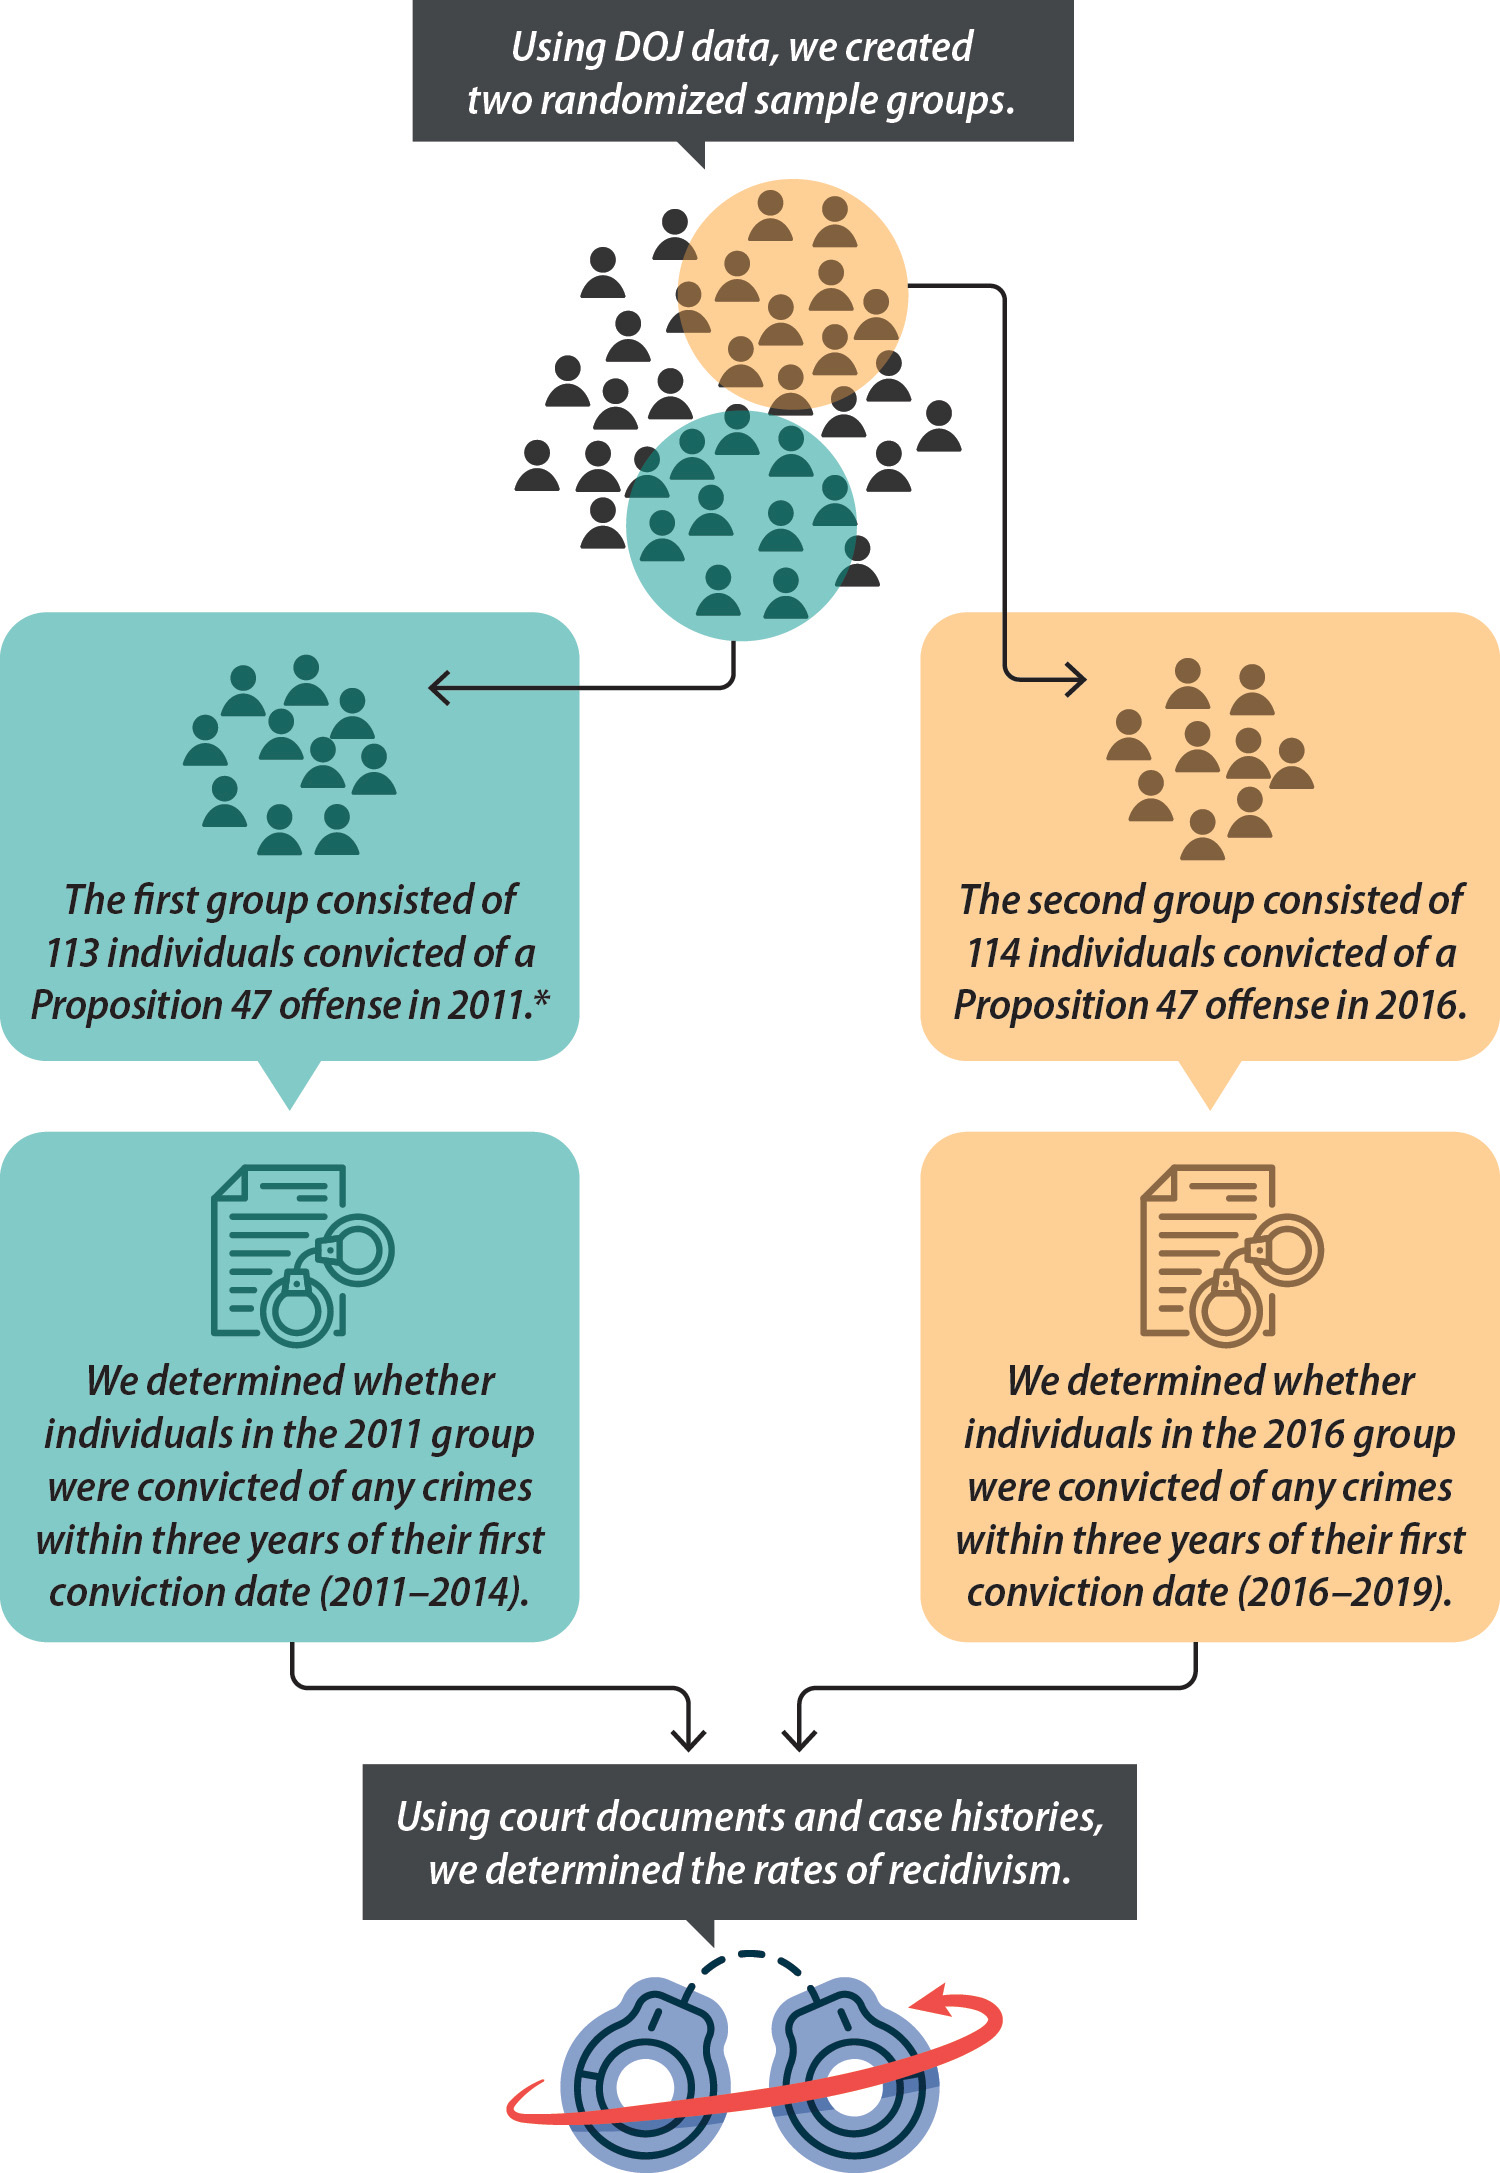
Source: DOJ; analysis of court records and publicly available case histories from San Bernardino and Riverside counties.
* The sample size for this group was 113, but Riverside Superior Court attested it destroyed the records for six individuals in our sample pursuant to record retention law.
Figure C is a graphic depicting the methodology we used in determining recidivism at the three law enforcement agencies we reviewed. From DOJ data, we created two randomized sample groups. The creation of these two groups makes up the top of the graphic, which then splits into two sides, one for the 2011 group and one for the 2016 group. The first group consisted of 113 individuals convicted of a Proposition 47 offense in 2011. While the sample size for this group was 113, Riverside Superior Court attested it destroyed the records for six individuals in our sample pursuant to record retention law. In our review of this group from 2011, we determined whether the individuals were subsequently convicted of any crimes within three years of their first conviction date, essentially spanning a period of review from 2011 through 2014. The 2016 sample group consisted of 114 individuals convicted of a Proposition 47 offense in 2016. In our review of this group, we determined whether the individuals were subsequently convicted of any crimes within three years of their first conviction date, essentially spanning a period of review from 2016 through 2019. For both of these groups, as we describe at the end of the graphic, we used court documents and case histories to determine the rates of recidivism.
Appendix D
Scope and Methodology
The Audit Committee requested the California State Auditor to conduct an audit of the effects of Proposition 47 in San Bernardino and Riverside counties. Table D lists the objectives that the Audit Committee approved and the methods we used to address them. Unless otherwise stated in Table D or elsewhere in the report, statements and conclusions about items selected for review should not be projected to the population.
Assessment of Data Reliability
The U.S. Government Accountability Office, whose standards we are statutorily obligated to follow, requires us to assess the sufficiency and appropriateness of computer-processed information that we use to support our findings, conclusions, or recommendations. In performing this audit, we relied on various data sources. To determine trends of suspected offenses being reported to law enforcement agencies before and after the implementation of Proposition 47, and to assess any changes in law enforcement’s response to these reports, we obtained calls for service data from Riverside Sheriff, Riverside Police, and San Bernardino Police. Additionally, we analyzed arrest data from these same law enforcement agencies before and after the implementation of Proposition 47. Finally, we relied on criminal history data from DOJ to identify convictions related to Proposition 47. To assess these data, we interviewed staff knowledgeable about the data, reviewed available information about the data, and performed testing of the data. Although the law enforcement agencies asserted that some offenses go unreported, we focused our analysis on those offenses that were reported to the law enforcement agencies. As a result, we determined that these data were sufficiently reliable for the purposes of our audit.
We also relied on data from Riverside county jail information management system to identify any trends related to actual time served. To assess these data, we interviewed staff knowledgeable about the data. We determined that these data were sufficiently reliable for the purposes of our audit.
Lastly, we relied on data from Riverside and San Bernardino county superior courts to review and analyze case histories, court records, and other relevant information. To assess these data, we interviewed staff knowledgeable about the data. We determined that these data were also sufficiently reliable for the purposes of our audit.
Response
Riverside County Sheriff’s Office
June 10, 2024
California State Auditor’s Office
Grant Parks, California State Auditor
621 Capitol Mall, Suite 1200
Sacramento, CA 95814
RE: Objection to Proposition 47 Audit Report
Dear Mr. Parks,
Your office was tasked by the legislature to compile a report (2023-107) related to the effects of Proposition 47 in San Bernardino and Riverside counties. Our agency has cooperated with your office as requested; however, this letter is to inform you, in writing, of our objection to the procedures and findings of said report.
① On May 9, 2024, employees of your office met with our executive staff to discuss the report’s draft. This meeting was named, “Prop 47 Exit Conference.” Your office sent a draft of the report to our executive staff the day of the meeting. We verbally objected to the untimeliness of the report because we did not have enough time as an organization to review the report prior to the meeting. Furthermore, the report was heavily redacted and missing numerous pages. For these reasons, we requested to continue the “Prop 47 Exit Conference” to a later date.
① We rescheduled the “Prop 47 Exit Conference” to May 30, 2024. We were once again provided a heavily redacted report and although we objected, we decided to continue with the conference call because we did not want your office to suggest to the public that we failed to cooperate with your office.
① Although we have yet to review the entire report due to the redactions, the portions relating to our agency fail to accurately reflect our data, both statistically and anecdotally. As communicated to your office on several occasions, our RMS/CAD and call type data is not easily reduced to the data points your office requested. For example, we do not have a specific call type for “organized retail theft” and all thefts are lumped into groups – petty, grand, fraud and burglary. ② Many cases involve multiple theft types, and some may be “organized retail theft” but closed out as petty theft, grand theft, or even burglary by the initial responding deputy. To accurately extrapolate “organized retail theft” from our data, we would have to analyze each individual case to determine if it met the legal definition of “organized retail theft.” Furthermore, not all arrests for theft related calls can be easily extrapolated from our RMS/CAD reports either. Some calls can be closed “exceptional” while some closed “arrest,” but both can lead to someone being released, arrested, cited, or with criminal charges filed “out of custody.” In other words, we are unable to provide you with accurate data points based on the narrow definitions and parameters your office has set for this specific report.
③ The report also discounts our anecdotal data even though our deputies and business owners experience the consequences of Proposition 47 every day. Nowhere in your report are statements from local business owners who have been burglarized, robbed, or stolen from. ④ Nowhere in your report does it account for businesses that have amended their policies to no longer call the police. For example, large corporations like Target generally do not call law enforcement for petty thefts anymore due to Proposition 47’s theft reclassifications. Without these accounts and data, this report paints a rosier picture to the public and it is deceiving.
⑤ Nowhere in your report did it account for the California Highway Patrol’s (CHP) data until we brought this to your attention. The final report provided to us makes a hollow nod to CHP but does not include any statistical data.
⑤ As the public is aware, the legislature has devoted millions of dollars to the CHP to establish “organized retail theft” task forces throughout the state. Although we do not have one in our county, many of our neighboring counties do. Many of those investigations lead to our county but for several legal and jurisdictional reasons, they are not documented in our county. This data is important to include because your report inaccurately and deceivingly cites that out of 222,000 total arrests made by the report’s selected agencies, we only made 33 organized retail theft arrests. This statistic does not account for those cases we may have turned over to a CHP task force or for those that were not accurately captured by our data due to our nuanced call types and call closures. Without proper context, your office is misleadingly suggesting that organized retail theft is not a problem regardless of what the people experience and see in the media every day.
① ⑥ An additional concern we have is that your office has prevented our agency from viewing San Bernardino County’s data and perspectives. It is public knowledge that their agency underwent a significant cyber-attack recently and they lost a substantial amount of data because of it. Does your report account for that? If you did receive data from their agency, is it accurate or is it compromised? Our fear is that if you did receive data from San Bernardino County, is it reliable? If their data is not reliable or lacking, and if your office is unable to accurately reflect our data, how reliable is this report to the public?
⑦ More disturbing is that this report caters directly to Governor Newsom’s recent announcement and mandate to the legislature to build upon his “Real Public Safety Plan” by recommending stronger penalties and adjustments to theft crimes. His proposal provides a framework to enhance current laws but falls short of recommending a complete repeal of Proposition 47. ⑧ Interestingly, this report recommends those same proposals, but does not provide an alternate recommendation or suggestion to the legislative body to repeal Proposition 47. Without this recommendation to the legislature, this report is nothing other than Governor Newsom ‘s proposal in different clothing. California demands objective audit reports that contain accurate and unbiased data. This report fails to meet those demands – it is highly subjective, not accurate and it is swayed by Governor Newsom ‘s political oversight of your office.
⑨ We object to this report being released to the public and the legislature for these reasons. Should you have any questions or concerns, feel free to reach out to me directly, or you may reach out to my Chief Deputy, Zachary Hall, at (951) 955-2400. Thank you.
Sincerely,
CHAD BIANCO, SHERIFF
Comments
California State Auditor’s Comments on the Response From Riverside Sheriff
To provide clarity and perspective, we are commenting on Riverside Sheriff’s response to our audit. The numbers below correspond to the numbers we have placed in the margin of its response.
① We informed Riverside Sheriff throughout the audit that the Government Code sections 8545 and 8545.1 make it a misdemeanor to disclose any substantive information about an audit before it is completed and that this includes information pertaining to other audited entities. Thus, we did not provide Riverside Sheriff with our conclusions related to the other audited entities. Riverside Sheriff is incorrect in suggesting that we provided them with untimely information on our report findings. In accordance with our standard practice, we shared our preliminary findings with Riverside Sheriff throughout the audit, which necessitated that we contact them on numerous occasions when they did not respond to our requests for information.
② We worked closely with Riverside Sheriff’s staff to obtain and analyze RMS and CAD data. As a result, when we were analyzing arrests, we did not use the CAD call closure reasons that Riverside Sheriff discusses in its response. Instead, we used the approach Riverside Sheriff’s staff recommended, which included directly analyzing arrest data in RMS. This information allowed us to identify the number of and reasons for arrests, and we stand by our analysis and conclusions. Finally, we present data on the number of arrest charges for burglary and theft—including petty theft and grand theft—which show a decrease of nearly 22 percent at Riverside Sheriff from 2014 through 2022. Thus, even if Riverside Sheriff was charging individuals with other types of theft offenses, the data indicates that the number of those arrest charges has decreased since the proposition’s implementation.
③ As we state, Riverside Sheriff was unable to provide evidence apart from anecdotes to substantiate that underreporting of Proposition 47 offenses was occurring. We provided Riverside Sheriff the opportunity to support their claims, but Riverside Sheriff’s staff was unable to produce anything other than assertions. We already provide the Sheriff’s perspective in the report.
④ Riverside Sheriff improperly assumes we did not attempt to determine whether retailers underreported theft offenses. As we state, we contacted the California Retailer’s Association to discuss theft reporting by its members. However, the association informed us that it did not have any data available on how frequently retailers reported thefts to law enforcement. We also reviewed the National Retail Federation’s publicly available survey data and the survey did not provide information on reporting practices by retailers to law enforcement. However, we have no legal authority to access the records of private entities unless a public entity being audited has access to the records, or the private entities provide the records voluntarily. Thus, we relied on available data and stand by our conclusions.
⑤ The Legislature requested an audit of the impact of Proposition 47 in San Bernardino and Riverside counties, not organized retail theft, which is outside the scope of our audit. The penal code sections for organized retail theft we referenced were enacted years after the implementation of Proposition 47. We present information about organized retail theft for informational purposes only, but do not have any findings, conclusions or recommendations about that information. Further, in response to feedback from Riverside Sheriff, we explain that the number from the three law enforcement agencies may not represent the total number of arrest charges for organized retail theft in Riverside and San Bernardino counties. However, we did find an increase in repeat theft offenses, and recommended that if the Legislature decides that it wants to take action to reduce the likelihood that individuals with four or more convictions will continue to engage in theft, the Legislature may consider the adoption of several policy mechanisms.
⑥ As we indicate, we removed the San Bernardino County Sheriff’s Department from our review during the course of the audit due to the ransomware attack that rendered much of its data unavailable.
⑦ State law mandates that our office be independent of the executive branch and legislative control. Further, state law also requires the California State Auditor’s Office to conduct all of its audits in accordance with auditing standards issued by the U.S. Comptroller General’s Government Accountability Office. The auditing standards we are statutorily required to follow also have provisions which guide our independence from other entities. In addition, we base our conclusions on sufficient and appropriate evidence in conformance with auditing standards.
⑧ The Riverside Sheriff believes that the report should include a recommendation to repeal Proposition 47. However, the Legislature’s ability to repeal Proposition 47 is limited by both Proposition 47’s terms and the State Constitution. Nevertheless, we do acknowledge the steps that the Legislature could take to allow the voters to repeal it. Moreover, our report presents detailed data and analysis that found the length of sentences had decreased after the implementation of Proposition 47, in line with the law’s intended purpose, but that the number of repeat theft convictions had also increased. Thus, in accordance with auditing standards and best practices, our recommendations relate to the significant issues that we identified and they do not extend to areas outside the scope of our review and findings.
⑨ Although Riverside Sheriff objects to the public release of our report, we are required by law to make our audit reports available to the public in accordance with Government Code Section 8546.1.
Footnotes
- Prosecutors and courts can choose to designate certain criminal offenses, such as willfully violating promises to appear in court, disturbing the peace, or driving without a valid license, as infractions. An infraction is not punishable by imprisonment. ↩︎
- State law divides theft into two degrees: grand and petty. Grand theft can incur more severe punishment than petty theft. ↩︎
- The director of Finance is responsible for calculating these savings and bases that calculation on the amount saved from reduced prison use. ↩︎
- Organized retail theft became a criminal offense effective January 1, 2019, several years after Proposition 47 was implemented. ↩︎
- San Bernardino Police’s CAD data are only complete dating back to 2012. ↩︎
- Magnus Lofstrom, Brandon Martin, Andrew Skelton, “California’s Notable Declines in Law Enforcement Staffing,” February 14, 2023. ↩︎
- San Bernardino Police’s RMS data are only complete dating back to 2012. ↩︎
- Our results for the overall rates of reoffense were not found to be statistically significant. ↩︎
- Our results for those with four or more convictions were determined to be statistically significant at an 80 percent confidence level. However, studies by the U.S. Department of Justice Bureau of Justice Statistics use a 95 percent confidence level for determining significance. For more information regarding statistical significance, refer to Appendix C. ↩︎
- For our 2011 cohort, the lower limit is 492 and the upper limit is 831, with a best estimate of 652. For our 2016 cohort, the lower limit is 708 and the upper limit is 1,067, with a best estimate of 884. ↩︎
- Our results were determined to be statistically significant at an 85 percent confidence level. However, studies by the U.S. Department of Justice Bureau of Justice Statistics use a 95 percent confidence level for determining significance. For more information regarding statistical significance, refer to Appendix C. ↩︎
- The average length of time served was 40 days in jail for our 2016 group. Of the records we reviewed for Proposition 47 offenses in which an individual was sentenced to jail time, the main reasons individuals did not spend the full sentenced time in jail included court orders to alleviate overcrowding, work release programs, and good behavior credits. However, Proposition 47 did not amend or alter these reasons. ↩︎
- Organized retail theft became a criminal offense effective January 1, 2019, several years after Proposition 47 was implemented. ↩︎
- BSCC, “Proposition 47 Cohort II: Statewide Evaluation,” February 2024, https://www.bscc.ca.gov/wp-content/uploads/2024/02/H-2-Proposition-47-Cohort-2-Final-Evaluation-Report-FINAL-1.pdf, accessed on April 25, 2024. ↩︎
- The BSCC study indicated that the statewide recidivism rates may not be equitable recidivism timeframe comparison groups. ↩︎
- National Institute of Justice, “Program Profile: The Impact of California’s Proposition 47 (The Reduced Penalties for Some Crimes Initiative) on Recidivism,” November 2021, https://crimesolutions.ojp.gov/ratedprograms/740#8-0, accessed on April 25, 2024. ↩︎
- The sample size for this group was 113, but Riverside Superior Court attested it destroyed the records for six individuals in our sample pursuant to record retention law. ↩︎
